Tools
As part of this project, we built tools to help profile memory usage and network usage. This is a brief introduction; for detailed usage, please refer to our tbd-tools github repository.
Network Profiler
We built our network profiler based on MXNet v1.1.0. The profiler shows the communication delay of each individual layer in the neural network during distributed training. The results are presented in json format, which can be opened from chrome://tracing. Here we show the example of a network transfer timeline for training VGG-19:
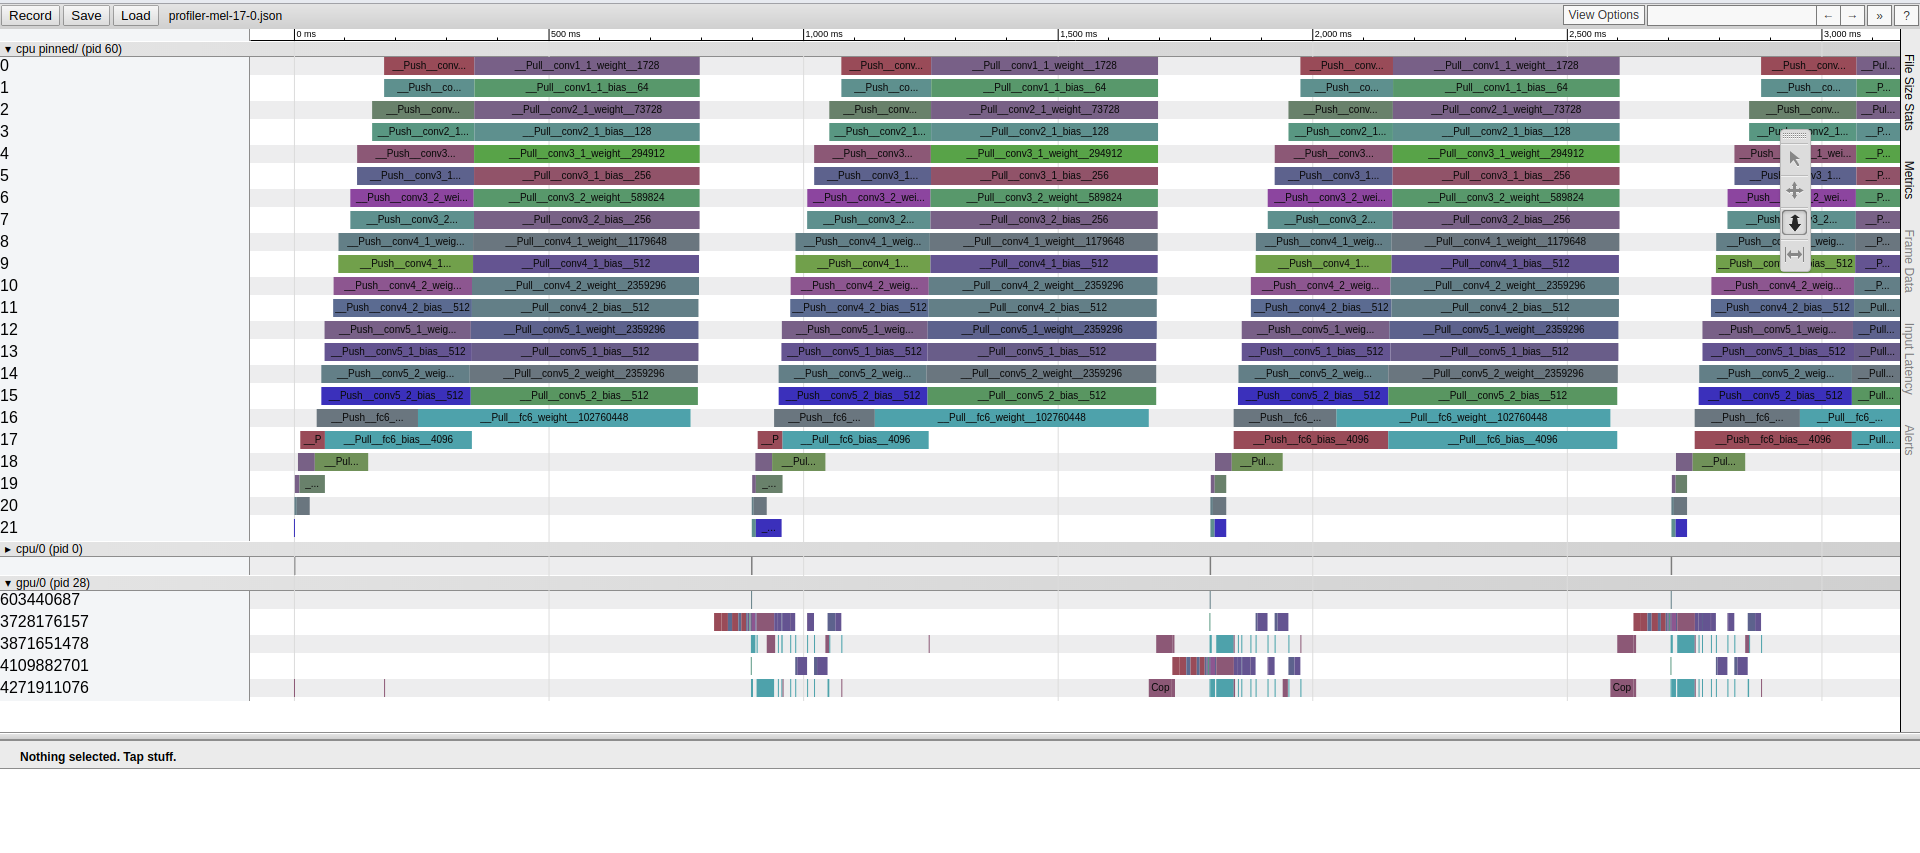
The communication delay of each layer is shown at the top under the CPU Pinned section. The layers are indexed according to its position in the neural network starting from 0 for the first layer.
Ideally, we want communication overlapped with computation so that it doesn't become the bottleneck of training, enabling high scalability. In the figure above, it is apparent that most of the gaps between GPU timeline blocks are filled by communication, which indicates that communication introduces a lot of overhead.