Tools
As part of this project, we built tools to help profile memory usage and network usage. This is a brief introduction; for detailed usage, please refer to our tbd-tools github repository.
Memory Profiler
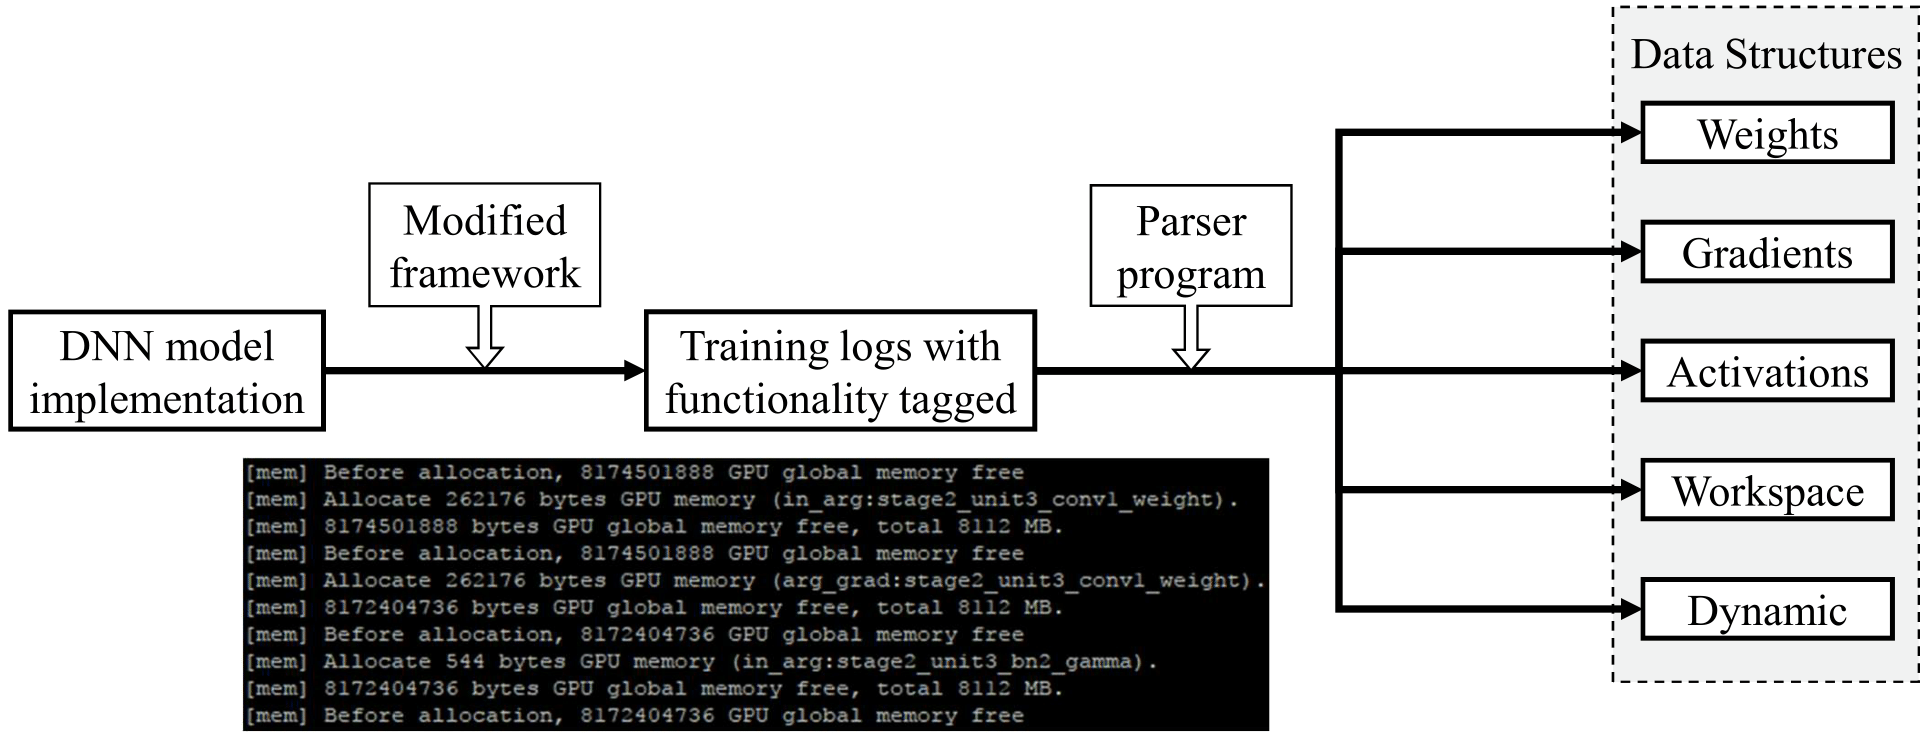
We built memory profilers for TensorFlow, MXNet and CNTK. The goal of a memory profiler is to show the breakdown of the bulk of GPU allocated memory involved in DNN training. We classify allocations according to data structure, including:
- Weights: weights, biases, etc.
- Gradients: calculated in the backward pass, often has equal size with Weights.
- Activations (or feature maps): intermediate results generated in the forward pass and reused in the backward pass. This is the major consumer of GPU memory.
- Workspace: temporary space allocated for detailed implementations of operations (e.g. matrix multiplications, convolutions).
- Dynamic: (explained below).
How the memory profiler works
Our profiler works in two steps. The first step is to log each memory allocation issued by the framework (which necessitates making changes to framework code) and tag each allocation with the following information at a minimum:
- The size of the allocated memory.
- The type of the associated data structure (as above).
Generally, each framework employs a wrapper around low-level memory allocation calls, such as cudaMalloc(...). Unfortunately, the latter information is usually not directly accessible from the wrapper. To obtain this information, we must trace the call stack up to where the type of the data structure is known and pass that information back down to the wrapper. The definitions of all functions on the stack in between must be altered.
Unfortunately, due to the complexity of the code, it is often very difficult to trace the call stack and find the right place to pass data structure information. The allocation wrapper function may be called in the initialization function of a tensor, which is invoked in an enormous number of places, and only a small portion of initializations actually trigger memory allocation. Through research and careful analysis on the framework codebases, and with additional hacking skills, we managed to attach the correct data structure information to most of the memory allocations, though there are still potentially unclassified allocations that have not been accounted for yet. This issue can be incrementally fixed as we test the memory profiler with more applications.
The core code of TensorFlow, MXNet and CNTK are all written in C/C++. Since all of them support bindings with python, memory allocations may be triggered implicitly from python (especially for MXNet). To capture all these allocations and tag them with the correct data structure information likely requires a complete restructure of the framework code. Our memory profilers are not yet able to classify them. As we noticed, most of them are generated during the training epochs, while weights, gradients, activations are mostly initialized before training starts, We assign these allocations with a new type called "Dynamic".
After obtaining the memory allocation log, it can then be parsed by a simple python program that outputs the allocation breakdown results. The python program can easily tell the data structure if the proper keywords are attached. We aim to open source our modified version of the frameworks with memory profiling capability, alongside our python parsers soon.
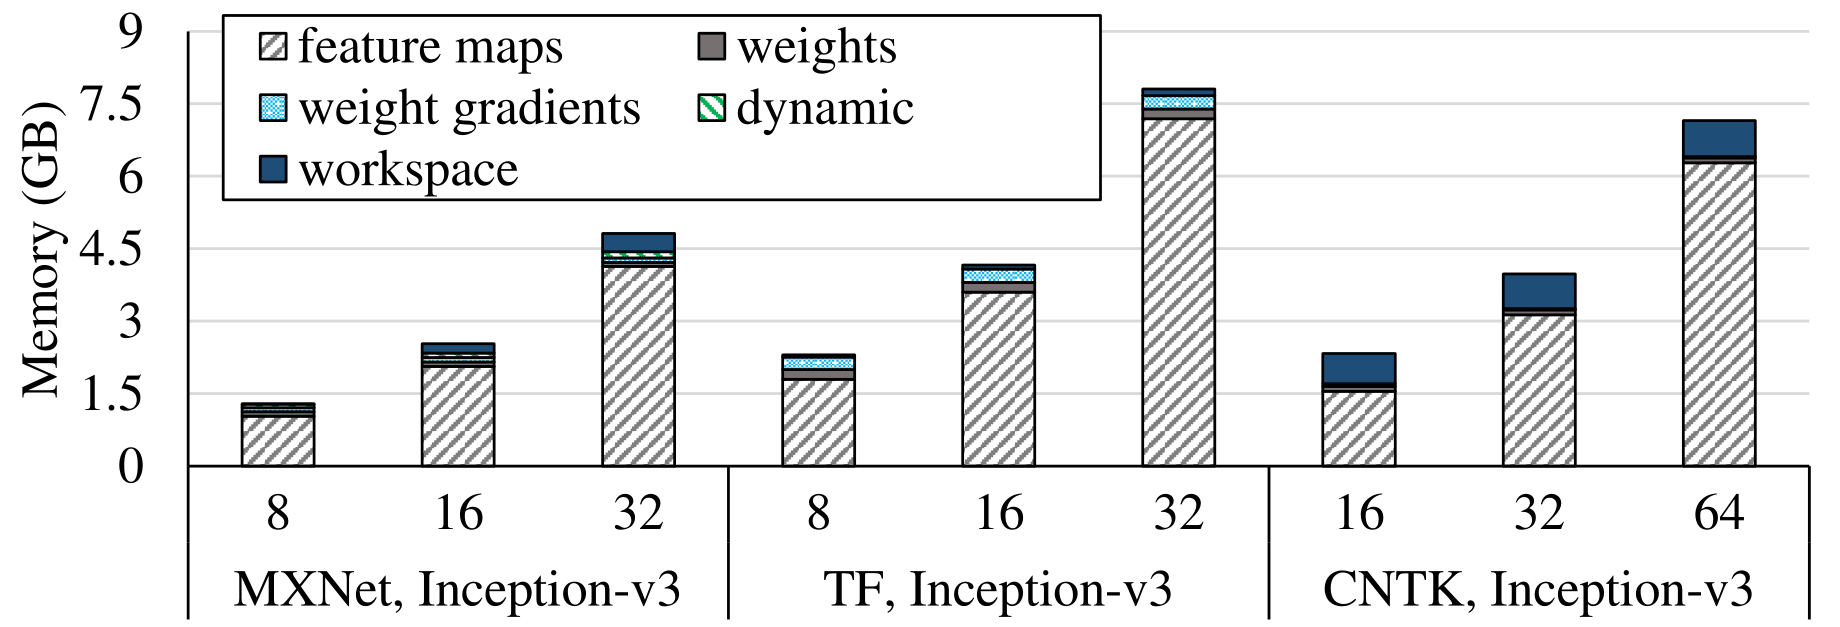
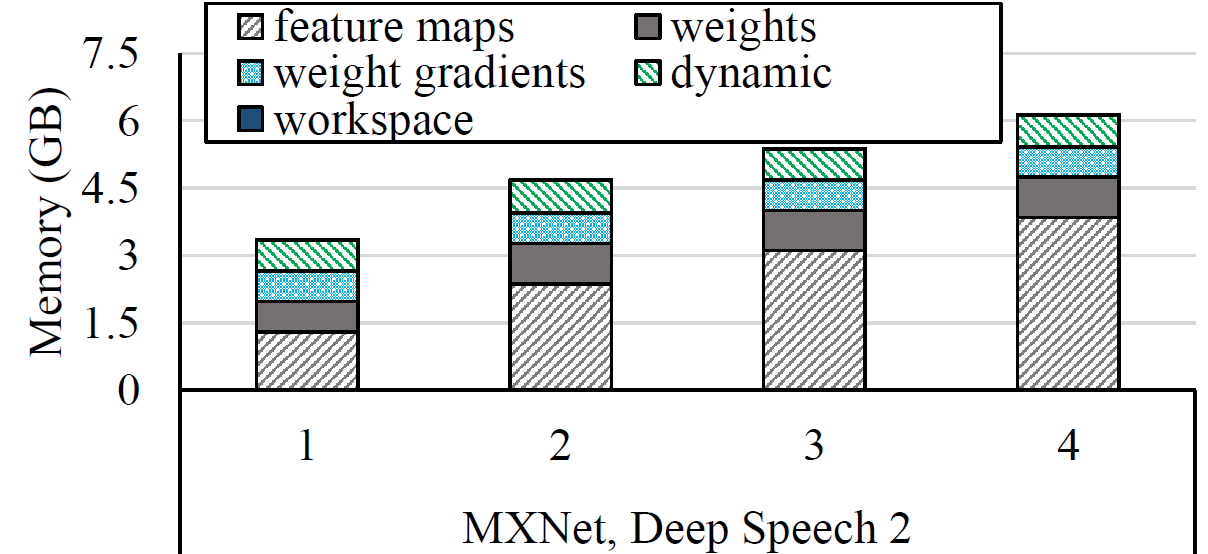
Example results
Below are two examples from Inception and Deep Speech 2 that show the results of our memory profiling.
Notice that the memory consumption calculated by our memory profiler is
less then the real memory consumption (one can check using nvidia-smi). The major
reason is memory paging. Since the page size is 2 MB, each memory
allocation that doesn't fully fit in a page contributes to inflating the actual memory consumption. The waste accumulated can
make the actual memory consumption hundreds of MB greater than the calculated memory consumption.
Current progress
We have been collaborating closely with MXNet developers to merge the memory profiler into the main branch. Please visit this page for the current status of the merging process.