

In this chapter we evaluate context threading by comparing its performance to direct threading and direct-threaded selective inlining. We evaluate the impact of each of our techniques on Pentium 4 and PowerPC processors by measuring the performance of a modified version of SableVM, a Java virtual machine and ocamlrun, an OCaml interpreter. We explore the differences between context threading and SableVM's selective inlining further by measuring a simple extension of context threading we call tiny inlining. Finally, we illustrate the range of improvement possible with subroutine threading by comparing the performance of subroutine-threaded Tcl and subroutine-threaded OCaml to direct threading on Sparc.
The overall results show that dispatching virtual instructions by calling virtual instruction bodies is very effective for Java and OCaml on Pentium 4 and PowerPC platforms. In fact, subroutine threading outperforms direct threading by a healthy margin of about 20%. Context threading is almost as fast as selective inlining as implemented by SableVM. Since these are dispatch optimizations, they offer performance benefits depending on the proportion of dispatch to real work. Thus, when a Tcl interpreter is modified to be subroutine-threaded, performance relative to direct threading increases only by about 5%. Subroutine threaded Ocaml is 13% faster than direct threading on the same Sparc processor.
We begin by describing our experimental setup in sec:exp_setup. We investigate how effectively our techniques address pipeline branch hazards in sec:exp_hazards, and the overall effect on execution time in sec:exp_performance. sec:inlining demonstrates that context threading is complementary to inlining and results in performance comparable to SableVM's implementation of selective inlining. Finally, sec:Limitations-of-Context discusses a few of the limitations of context threading by studying the performance of Vitale's subroutine-threaded Tcl [#!ct-tcl2005!#, Figure 1] and OCaml, on Sparc.
We evaluate our techniques by modifying interpreters for Java and
OCaml to run on Pentium 4, PowerPC 7410 and PPC970. The Pentium and
PowerPC are processors used by PC and Macintosh workstations and many
types of servers. The Pentium and PowerPC provide different architectures
for indirect branches (Figure ![]() illustrates the
differences) so we ensure our techniques work for both approaches.
illustrates the
differences) so we ensure our techniques work for both approaches.
Our experimental approach is to evaluate performance by measuring elapsed time. This is simple to measure and always relevant. We guard against intermittent events polluting any single run by always averaging across three executions of each benchmark.
We report pipeline hazards using the performance measurement counters of each processor. These vary widely not only between the Pentium and the PowerPC but also within each family. This is a challenge on the PowerPC, where IBM's modern PowerPC 970 is a desirable processor to measure, but has no performance counters for stalls caused by indirect branches. Thus, we use an older processor model, the PowerPC 7410, because it implements performance counters that the PowerPC 970 does not.
We choose two virtual machines for our experiments. OCaml is a simple, very cleanly implemented interpreter. However, there is only one implementation to measure and only a few relatively small benchmark programs are available. For this reason we also modified SableVM, a Java Virtual Machine.
We chose OCaml as representative of a class of efficient, stack-based interpreters that use direct-threaded dispatch. The bytecode bodies of the interpreter, in C, have been hand-tuned extensively, to the point of using gcc inline assembler extensions to hand-allocate important variables to dedicated registers. The implementation of the OCaml interpreter is clean and easy to modify [#!ocaml:book!#,#!ocamlsite!#].
Table:
Description of OCaml benchmarks. Raw elapsed time and branch hazard data for direct-threaded runs.
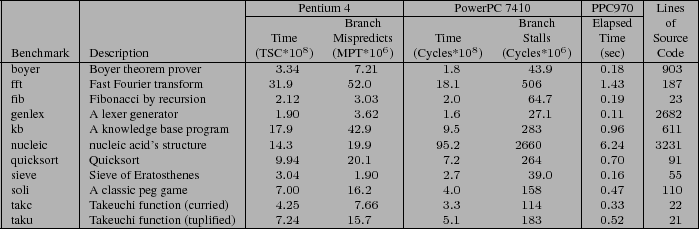
The benchmarks in Table ![]() make up the standard
OCaml benchmark suite
make up the standard
OCaml benchmark suite![]() . Boyer, kb, quicksort and sieve
do mostly integer processing, while nucleic and fft
are mostly floating point benchmarks. Soli is an exhaustive
search algorithm that solves a solitaire peg game. Fib, taku,
and takc are tiny, highly-recursive programs which calculate
integer values.
. Boyer, kb, quicksort and sieve
do mostly integer processing, while nucleic and fft
are mostly floating point benchmarks. Soli is an exhaustive
search algorithm that solves a solitaire peg game. Fib, taku,
and takc are tiny, highly-recursive programs which calculate
integer values.
Fib, taku, and takc are unusual because they contain very few distinct virtual instructions, and in some cases use only one instance of each. This has two important consequences. First, the indirect branch in direct-threaded dispatch is relatively predictable. Second, even minor changes can have dramatic effects (both positive and negative) because so few instructions contribute to the behavior.
SableVM is a Java Virtual Machine built for quick interpretation. SableVM implements multiple dispatch mechanisms, including switch, direct threading, and selective inlining (which SableVM calls inline threading [#!gagnon:inline-thread-prep-seq!#]). The support for multiple dispatch mechanisms facilitated our work to add context threading and allows for comparisons against other techniques, like inlining, that also address branch mispredictions. Finally, as part of its own inlining infrastructure, SableVM builds tables describing which virtual instruction bodies can be safely inlined using memcpy. This made our tiny inlining implementation very simple.
Table:
Description of SPECjvm98 Java benchmarks. Raw elapsed time and branch hazard data for direct-threaded runs.
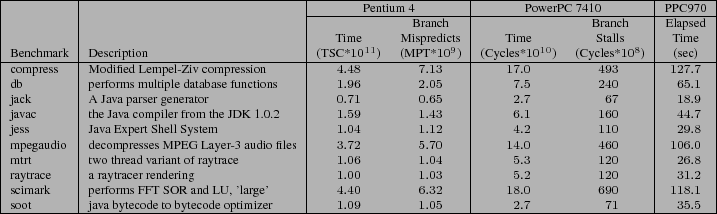
SableVM experiments were run on the complete SPECjvm98 [#!SPECjvm98!#]
suite (compress, db, mpegaudio, raytrace,
mtrt, jack, jess and javac), one
large object-oriented application (soot [#!vall99soot!#])
and one scientific application (scimark [#!Scimark!#]).
Table ![]() summarizes the key characteristics of
these benchmarks.
summarizes the key characteristics of
these benchmarks.
On both platforms we measure elapsed time averaged over three runs to mitigate noise caused by intermittent system events. We necessarily use platform and operating systems dependent methods to estimate pipeline hazards.
The Pentium 4 (P4) processor speculatively dispatches instructions
based on branch predictions. As discussed in Section ![]() ,
the indirect branches used for direct-threaded dispatch are often
mispredicted due to the lack of context. Ideally, we could measure
the cycles the processor stalls due to mispredictions of these branches,
but the P4 does not provide a performance counter for this purpose.
Instead, we count the number of mispredicted taken branches
(MPT) to measure how our techniques effect branch prediction. We measure
time on the P4 with the cycle-accurate time stamp counter (TSC)
register. We count both MPT and TSC events using our own Linux kernel
module, which collects complete data for the multithreaded Java benchmarks
,
the indirect branches used for direct-threaded dispatch are often
mispredicted due to the lack of context. Ideally, we could measure
the cycles the processor stalls due to mispredictions of these branches,
but the P4 does not provide a performance counter for this purpose.
Instead, we count the number of mispredicted taken branches
(MPT) to measure how our techniques effect branch prediction. We measure
time on the P4 with the cycle-accurate time stamp counter (TSC)
register. We count both MPT and TSC events using our own Linux kernel
module, which collects complete data for the multithreaded Java benchmarks![]() .
.
We need to characterize the cost of branches differently on the PowerPC
than on the P4. On the PPC architecture split branches are used (as
shown in Figure ![]() (b)) and the PPC stalls until
the branch destination is known
(b)) and the PPC stalls until
the branch destination is known![]() . Hence, we would like to count the
number of cycles stalled due to link and count register dependencies.
Unfortunately, PPC970 chips do not provide a performance counter for
this purpose; however, the older PPC7410 CPU has a counter (counter
15, ``stall on LR/CTR dependency'') that provides exactly the
information we need [#!motorola:mpc7410!#]. On the PPC7410, we
also use the hardware counters to obtain overall execution times in
terms of clock cycles. We expect that the branch stall penalty should
be larger on more deeply-pipelined CPUs like the PPC970, however,
we cannot directly verify this. Instead, we report only elapsed execution
time for the PPC970.
. Hence, we would like to count the
number of cycles stalled due to link and count register dependencies.
Unfortunately, PPC970 chips do not provide a performance counter for
this purpose; however, the older PPC7410 CPU has a counter (counter
15, ``stall on LR/CTR dependency'') that provides exactly the
information we need [#!motorola:mpc7410!#]. On the PPC7410, we
also use the hardware counters to obtain overall execution times in
terms of clock cycles. We expect that the branch stall penalty should
be larger on more deeply-pipelined CPUs like the PPC970, however,
we cannot directly verify this. Instead, we report only elapsed execution
time for the PPC970.
In presenting our results, we normalize all experiments to the direct
threading case, since it is considered a state-of-the art dispatch
technique. (For instance, the source distribution of OCaml configures
for direct threading.) We give the absolute execution times and branch
hazard statistics for each benchmark and platform using direct threading
in Tables ![]() and
and ![]() . Bar graphs
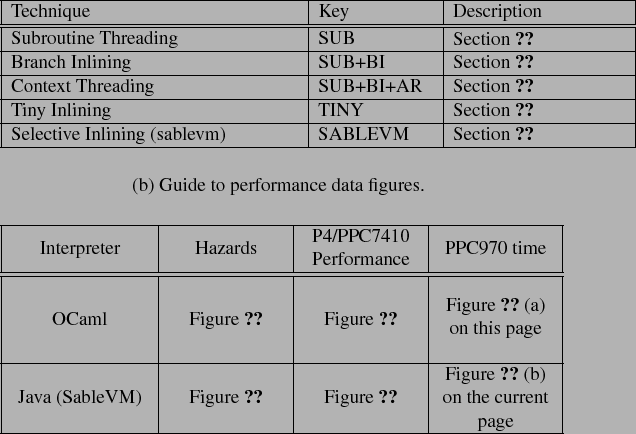
in the following sections show the contributions of each component
of our technique: subroutine threading only (labeled SUB); subroutine
threading plus branch inlining and branch replication for exceptions
and indirect branches (labeled SUB+BI); and our complete context threading
implementation which includes apply/return inlining (labeled SUB+BI+AR.
We include bars for selective inlining in SableVM (labeled SABLEVM)
and our own simple inlining technique (labeled TINY)
to facilitate comparisons, although inlining results are not discussed
until Section
. Bar graphs
in the following sections show the contributions of each component
of our technique: subroutine threading only (labeled SUB); subroutine
threading plus branch inlining and branch replication for exceptions
and indirect branches (labeled SUB+BI); and our complete context threading
implementation which includes apply/return inlining (labeled SUB+BI+AR.
We include bars for selective inlining in SableVM (labeled SABLEVM)
and our own simple inlining technique (labeled TINY)
to facilitate comparisons, although inlining results are not discussed
until Section ![]() . We do not show a bar for direct
threading because it would, by definition, have height 1.0. Table
. We do not show a bar for direct
threading because it would, by definition, have height 1.0. Table ![]() provides a key to the acronyms used as labels in the following graphs.
provides a key to the acronyms used as labels in the following graphs.
![\begin{centering}{\small\includegraphics[width=1\columnwidth,keepaspectratio]{graphs-cgo/objcaml_breakdown_mpt_normalized_direct}}\par
\end{centering}% WIDTH=494 HEIGHT=349](img30.png)

![\begin{centering}{\small\includegraphics[width=1\columnwidth,keepaspectratio]{graphs-cgo/objcaml_ppc7410_stalls_normalized_direct}}\par
\end{centering}% WIDTH=494 HEIGHT=349](img32.png)

![\begin{centering}{\small\includegraphics[width=1\columnwidth,keepaspectratio]{graphs-cgo/sablevm_mpt_normalized_direct}}\par
\end{centering}% WIDTH=520 HEIGHT=341](img34.png)

![\begin{centering}{\small\includegraphics[width=1\columnwidth,keepaspectratio]{graphs-cgo/sable_ppc7410_stalls_normalized_direct}}\par
\end{centering}% WIDTH=520 HEIGHT=341](img36.png)

Context threading was designed to align virtual program state with physical machine state to improve branch prediction and reduce pipeline branch hazards. We begin our evaluation by examining how well we have met this goal.
Figure ![]() reports the extent to which context threading
reduces pipeline branch hazards for the OCaml benchmarks, while Figure
reports the extent to which context threading
reduces pipeline branch hazards for the OCaml benchmarks, while Figure ![]() reports these results for the Java benchmarks on SableVM. At the top
of both figures, the graph labeled (a) presents the results on the
P4, where we count mispredicted taken branches (MPT). At bottom of
the figures, the graphs labeled (b) present the effect on LR/CTR stall
cycles on the PPC7410. The last cluster of each bar graph reports
the geometric mean across all benchmarks.
reports these results for the Java benchmarks on SableVM. At the top
of both figures, the graph labeled (a) presents the results on the
P4, where we count mispredicted taken branches (MPT). At bottom of
the figures, the graphs labeled (b) present the effect on LR/CTR stall
cycles on the PPC7410. The last cluster of each bar graph reports
the geometric mean across all benchmarks.
Context threading eliminates most of the mispredicted taken branches
(MPT) on the Pentium 4 and LR/CTR stall cycles on the PPC7410, with
similar overall effects for both interpreters. Examining Figures ![]() and
and ![]() reveals that subroutine threading has the single
greatest impact, reducing MPT by an average of 75% for OCaml and
85% for SableVM on the P4, and reducing LR/CTR stalls by 60% and
75% on average for the PPC7410. This result matches our expectations
because subroutine threading addresses the largest single source of
unpredictable branches--the dispatch used for straight-line sequences
of virtual instructions. Branch inlining has the next largest effect,
since conditional branches are the most significant remaining pipeline
hazard after applying subroutine threading. On the P4, branch inlining
cuts the remaining MPTs by about 60%. On the PPC7410 branch inlining
has a smaller, yet still significant effect, eliminating about 25%
of the remaining LR/CTR stall cycles. A notable exception to the MPT
trend occurs for the OCaml micro-benchmarks Fib, takc
and taku. These tiny recursive micro benchmarks contain few
duplicate virtual instructions and so the Pentium's branch target
buffer (BTB) mostly predicts correctly and inlining the conditional
branches cannot help.
reveals that subroutine threading has the single
greatest impact, reducing MPT by an average of 75% for OCaml and
85% for SableVM on the P4, and reducing LR/CTR stalls by 60% and
75% on average for the PPC7410. This result matches our expectations
because subroutine threading addresses the largest single source of
unpredictable branches--the dispatch used for straight-line sequences
of virtual instructions. Branch inlining has the next largest effect,
since conditional branches are the most significant remaining pipeline
hazard after applying subroutine threading. On the P4, branch inlining
cuts the remaining MPTs by about 60%. On the PPC7410 branch inlining
has a smaller, yet still significant effect, eliminating about 25%
of the remaining LR/CTR stall cycles. A notable exception to the MPT
trend occurs for the OCaml micro-benchmarks Fib, takc
and taku. These tiny recursive micro benchmarks contain few
duplicate virtual instructions and so the Pentium's branch target
buffer (BTB) mostly predicts correctly and inlining the conditional
branches cannot help.
Interestingly, the same three OCaml micro benchmarks Fib,
takc and taku that challenge branch inlining on
the P4 also reap the greatest benefit from apply/return inlining,
as shown in Figure ![]() (a). (This appears as the significant
improvement of SUB+BI+AR relative to SUB+BI.) Due to the recursive
nature of these benchmarks, their performance is dominated by the
behavior of virtual calls and returns. Thus, we expect predicting
the returns to have significant impact.
(a). (This appears as the significant
improvement of SUB+BI+AR relative to SUB+BI.) Due to the recursive
nature of these benchmarks, their performance is dominated by the
behavior of virtual calls and returns. Thus, we expect predicting
the returns to have significant impact.
For SableVM on the P4, however, our implementation of apply/return
inlining is restricted by the fact that gcc-generated code touches
the processor's esp register. Rather than implement a complicated
stack switching technique, as discussed in Section ![]() ,
we allow the virtual and machine stacks to become misaligned and then
manipulate the esp directly. This reduces the performance
of our apply/return inlining implementation, presumably by somehow
impeding the operation of the return address stack predictor. This
can be seen in Figure
,
we allow the virtual and machine stacks to become misaligned and then
manipulate the esp directly. This reduces the performance
of our apply/return inlining implementation, presumably by somehow
impeding the operation of the return address stack predictor. This
can be seen in Figure ![]() (a), where adding apply/return
inlining increases mispredicted branches. On the PPC7410, the effect
of apply/return inlining on LR/CTR stalls is very small for SableVM.
(a), where adding apply/return
inlining increases mispredicted branches. On the PPC7410, the effect
of apply/return inlining on LR/CTR stalls is very small for SableVM.
Having shown that our techniques can significantly reduce pipeline branch hazards, we now examine the impact of these reductions on overall execution time.
Figure:
OCaml Elapsed Time Relative to Direct Threading
![\begin{centering}{\small\includegraphics[width=1\columnwidth,keepaspectratio]{graphs-cgo/objcaml_breakdown_tsc_normalized_direct}}\par
\end{centering}% WIDTH=494 HEIGHT=349](img38.png)

![\begin{centering}{\small\includegraphics[width=1.05\columnwidth,keepaspectratio]{graphs-cgo/objcaml_ppc7410_cycles_normalized}}\par
\end{centering}% WIDTH=518 HEIGHT=366](img40.png)

![\begin{centering}{\small\vspace{-0.5in}
\includegraphics[width=1\columnwidth,keepaspectratio]{graphs-cgo/sable_tsc_normalized_direct}}\par
\end{centering}% WIDTH=520 HEIGHT=341](img42.png)

![\begin{centering}{\small\includegraphics[width=1.05\columnwidth,keepaspectratio]{graphs-cgo/sable_ppc7410_cycles_normalized}}\par
\end{centering}% WIDTH=546 HEIGHT=359](img44.png)
![\begin{centering}{\small s\includegraphics[width=1.05\columnwidth,keepaspectratio]{graphs-cgo/objcaml_ppc970_time_normalized_direct}}\par
\end{centering}% WIDTH=550 HEIGHT=374](img45.png)

![\begin{centering}{\small\includegraphics[width=1.05\columnwidth,keepaspectratio]{graphs-cgo/sable_ppc970_time_normalized_direct}}\par
\end{centering}% WIDTH=546 HEIGHT=359](img47.png)

Context threading improves branch prediction, resulting in better use of the pipelines on both the P4 and the PPC. However, using a native call/return pair for each dispatch increases instruction overhead. In this section, we examine the net result of these two effects on overall execution time. As before, all data is reported relative to direct threading.
Figures ![]() and
and ![]() show results for the
OCaml and SableVM benchmarks, respectively. They are organized in
the same way as the previous figures, with P4 results at the top,
labeled (a), and PPC7410 results at the bottom, labeled (b). Figure
show results for the
OCaml and SableVM benchmarks, respectively. They are organized in
the same way as the previous figures, with P4 results at the top,
labeled (a), and PPC7410 results at the bottom, labeled (b). Figure
![]() shows the performance of OCaml and SableVM on the
PPC970 CPU. The geometric means (rightmost cluster) in Figures
shows the performance of OCaml and SableVM on the
PPC970 CPU. The geometric means (rightmost cluster) in Figures ![]() ,
,
![]() and
and ![]() show that context threading
significantly outperforms direct threading on both virtual machines
and on all three architectures. The geometric mean execution time
of the OCaml VM is about 19% lower for context threading than direct
threading on P4, 9% lower on PPC7410, and 39% lower on the PPC970.
For SableVM, SUB+BI+AR, compared with direct threading, runs about
17% faster on the PPC7410 and 26% faster on both the P4 and PPC970.
Although we cannot measure the cost of LR/CTR stalls on the PPC970,
the greater reductions in execution time are consistent with its more
deeply-pipelined design (23 stages vs. 7 for the PPC7410).
show that context threading
significantly outperforms direct threading on both virtual machines
and on all three architectures. The geometric mean execution time
of the OCaml VM is about 19% lower for context threading than direct
threading on P4, 9% lower on PPC7410, and 39% lower on the PPC970.
For SableVM, SUB+BI+AR, compared with direct threading, runs about
17% faster on the PPC7410 and 26% faster on both the P4 and PPC970.
Although we cannot measure the cost of LR/CTR stalls on the PPC970,
the greater reductions in execution time are consistent with its more
deeply-pipelined design (23 stages vs. 7 for the PPC7410).
Across interpreters and architectures, the effect of our techniques
is clear. Subroutine threading has the single largest impact on elapsed
time. Branch inlining has the next largest impact eliminating an additional
3-7% of the elapsed time. In general, the reductions in execution
time track the reductions in branch hazards seen in Figures ![]() and
and ![]() . The longer path length of our dispatch technique
are most evident in the OCaml benchmarks fib and takc
on the P4 where the improvements in branch prediction (relative to
direct threading) are minor. These tiny benchmarks compile into unique
instances of a few virtual instructions. This means that there is
little or no sharing of BTB slots between instances and hence fewer
mispredictions.
. The longer path length of our dispatch technique
are most evident in the OCaml benchmarks fib and takc
on the P4 where the improvements in branch prediction (relative to
direct threading) are minor. These tiny benchmarks compile into unique
instances of a few virtual instructions. This means that there is
little or no sharing of BTB slots between instances and hence fewer
mispredictions.
The effect of apply/return inlining on execution time is minimal overall,
changing the geometric mean by only  1% with no discernible
pattern. Given the limited performance benefit and added complexity,
a general deployment of apply/return inlining does not seem worthwhile.
Ideally, one would like to detect heavy recursion automatically, and
only perform apply/return inlining when needed. We conclude that,
for general usage, subroutine threading plus branch inlining provides
the best trade-off.
1% with no discernible
pattern. Given the limited performance benefit and added complexity,
a general deployment of apply/return inlining does not seem worthwhile.
Ideally, one would like to detect heavy recursion automatically, and
only perform apply/return inlining when needed. We conclude that,
for general usage, subroutine threading plus branch inlining provides
the best trade-off.
We now demonstrate that context-threaded dispatch is complementary to inlining techniques.
Inlining techniques address the context problem by replicating bytecode bodies and removing dispatch code. This reduces both instructions executed and pipeline hazards. In this section we show that, although both selective inlining and our context threading technique reduce pipeline hazards, context threading is slower due to the overhead of its extra dispatch instructions. We investigate this issue by comparing our own tiny inlining technique with selective inlining.
In Figures ![]() ,
, ![]() and
and ![]() (b),
the bar labeled SABLEVM shows our measurements of Gagnon's selective
inlining implementation for SableVM [#!gagnon:inline-thread-prep-seq!#].
From these figures, we see that selective inlining reduces both MPT
and LR/CTR stalls significantly as compared to direct threading, but
it is not as effective in this regard as subroutine threading alone.
The larger reductions in pipeline hazards for context threading, however,
do not necessarily translate into better performance over selective
inlining. Figure
(b),
the bar labeled SABLEVM shows our measurements of Gagnon's selective
inlining implementation for SableVM [#!gagnon:inline-thread-prep-seq!#].
From these figures, we see that selective inlining reduces both MPT
and LR/CTR stalls significantly as compared to direct threading, but
it is not as effective in this regard as subroutine threading alone.
The larger reductions in pipeline hazards for context threading, however,
do not necessarily translate into better performance over selective
inlining. Figure ![]() (a) illustrates that SableVM's
selective inlining beats context threading on the P4 by roughly 5%,
whereas on the PPC7410 and the PPC970, both techniques have roughly
the same execution time, as shown in Figure
(a) illustrates that SableVM's
selective inlining beats context threading on the P4 by roughly 5%,
whereas on the PPC7410 and the PPC970, both techniques have roughly
the same execution time, as shown in Figure ![]() (b)
and Figure
(b)
and Figure ![]() (a), respectively. These results show
that reducing pipeline hazards caused by dispatch is not sufficient
to match the performance of selective inlining. By eliminating some
dispatch code, selective inlining can do the same real work with fewer
instructions than context threading.
(a), respectively. These results show
that reducing pipeline hazards caused by dispatch is not sufficient
to match the performance of selective inlining. By eliminating some
dispatch code, selective inlining can do the same real work with fewer
instructions than context threading.
Context threading is a dispatch technique, and can be easily combined
with an inlining strategy. To investigate the impact of dispatch instruction
overhead and to demonstrate that context threading is complementary
to inlining, we implemented Tiny Inlining, a simple heuristic
that inlines all bodies with a length less than four times the length
of our dispatch code. This eliminates the dispatch overhead for the
smallest bodies and, as calls in the CTT are replaced with comparably-sized
bodies, tiny inlining ensures that the total code growth is low. In
fact, the smallest inlined OCaml bodies on P4 were smaller
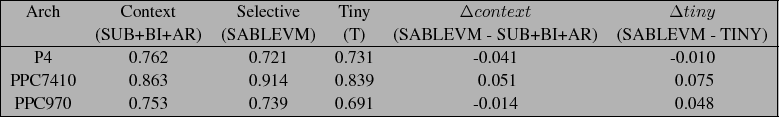
than the length of a relative call instruction (five bytes). Table ![]() summarizes the effect of tiny inlining. On the P4, we come within
1% of SableVM's selective inlining implementation. On PowerPC, we
outperform SableVM by 7.8% for the PPC7410 and 4.8% for the PPC970.
summarizes the effect of tiny inlining. On the P4, we come within
1% of SableVM's selective inlining implementation. On PowerPC, we
outperform SableVM by 7.8% for the PPC7410 and 4.8% for the PPC970.
Table:
Detailed comparison of selective inlining (SABLEVM) vs SUB+BI+AR
and TINY. Numbers are elapsed time relative to direct threading.  is the the difference between selective inlining and SUB+BI+AR.
  is the difference between selective inlining and TINY (the combination
of context threading and tiny inlining).
is the difference between selective inlining and TINY (the combination
of context threading and tiny inlining).
We discuss two limitations of our technique. The first describes how our technique, like most dispatch optimizations, can have only limited impact on virtual machines that implement large virtual instructions. The second issue describes the difficulty we experienced adding profiling to our implementation of context threading.
The techniques described
in this chapter address dispatch and hence have greater impact as
the frequency of dispatch increases relative to the real work carried
out. A key design decision for any virtual machine is the specific
mix of virtual instructions. A computation may be carried out by many
lightweight virtual instructions or fewer heavyweight ones. Figure
![]() shows that a Tcl interpreter
typically executes an order of magnitude more cycles per dispatched
virtual instruction than OCaml. Another perspective is that OCaml
executes proportionately more dispatch because its work is carved
up into smaller virtual instructions. In the figure, we see that many
OCaml benchmarks average only tens of cycles per dispatched instruction.
Thus, the time OCaml spends executing a typical body is of the same
order of magnitude as the branch misprediction penalty of a modern
CPU. On the other hand most Tcl benchmarks execute hundreds of cycles
per dispatch, many times the misprediction penalty. Thus, we expect
subroutine threading to speed up Tcl much less than OCaml. Figure
shows that a Tcl interpreter
typically executes an order of magnitude more cycles per dispatched
virtual instruction than OCaml. Another perspective is that OCaml
executes proportionately more dispatch because its work is carved
up into smaller virtual instructions. In the figure, we see that many
OCaml benchmarks average only tens of cycles per dispatched instruction.
Thus, the time OCaml spends executing a typical body is of the same
order of magnitude as the branch misprediction penalty of a modern
CPU. On the other hand most Tcl benchmarks execute hundreds of cycles
per dispatch, many times the misprediction penalty. Thus, we expect
subroutine threading to speed up Tcl much less than OCaml. Figure ![]() reports the performance of subroutine threaded OCaml on an UltraSPARC
III
reports the performance of subroutine threaded OCaml on an UltraSPARC
III![]() . As shown in the figure, subroutine threading speeds up OCaml on
the UltraSPARC by about 13%. In contrast, the geometric mean of 500
Tcl benchmarks speeds up only by only 5.4% [#!ct-tcl2005!#].
. As shown in the figure, subroutine threading speeds up OCaml on
the UltraSPARC by about 13%. In contrast, the geometric mean of 500
Tcl benchmarks speeds up only by only 5.4% [#!ct-tcl2005!#].
Figure:
Reproduction of [#!ct-tcl2005!#, Figure 1] showing cycles run per
virtual instructions dispatched for various Tcl and OCaml benchmarks
.
![\begin{centering}\includegraphics[width=0.5\columnwidth,keepaspectratio]{graphs-tcl/cycles_per_disp1000-legend}\par
\end{centering}% WIDTH=274 HEIGHT=263](img53.png)
Figure:
Elapsed time of subroutine threading relative to direct threading
for OCaml on UltraSPARC III.
![\begin{centering}\includegraphics[width=0.5\columnwidth]{graphs-tcl/ocaml_sparc_sub}\par
\end{centering}% WIDTH=242 HEIGHT=273](img54.png)
Another issue raised by the Tcl implementation was that about 12% of the 500 program benchmark suite slowed down. Very few of these dispatched more than 10,000 virtual instructions. Most were tiny programs that executed as little as a few dozen dispatches. This suggests that for programs that execute only a small number of virtual instructions, the load time overhead of generating code in the CTT may be too high.
Our original scheme for extending our context threaded interpreter with a JIT was to detect hot paths of the virtual program by generating calls to profiling instrumentation amongst the dispatch code in the CTT. We persevered for some time with this approach, and successfully implemented a system that identified traces [#!us_cascon2005!#]. The resulting implementation, though efficient, was fragile and required the generation of more machine specific code for profiling than we considered desirable. In the next chapter we describe a much more convenient approach based on dispatch loops.
SableVM is a very well engineered
interpreter. For instance, SableVM's infrastructure for identifying
un-relocatable virtual instruction bodies made implementing our TINY
inlining experiment simple. However, its heavy use of m4
and cpp macros, used to implement multiple dispatch mechanisms
and achieve a high degree of portability, makes debugging awkward.
In addition, our efforts to add profiling instrumentation to context
threading made many changes that we subsequently realized were ill-advised.
Hence, we decided to start from clean sources. For the next stage
of our experiment, our trace-based JIT, we decided to abandon SableVM
in favour of JamVM![]() .
.
Our experimentation with subroutine threading has established that calling virtual instruction bodies is an efficient way of dispatching virtual instructions. Subroutine threading is particularly effective at eliminating branch mispredictions caused by the dispatch of straight-line regions of virtual instructions. Branch inlining, though labor intensive to implement, eliminates the branch mispredictions caused by most virtual branches. Once the pipelines are full, the latency of dispatch instructions becomes significant. A suitable technique for addressing this overhead is inlining, and we have shown that context threading is compatible with our ``tiny'' inlining heuristic. With this simple approach, context threading achieves performance roughly equivalent to, and occasionally better than, selective inlining.
Our experiments also resulted in some warnings. First, our attempts
to finesse the implementation of virtual branch instructions using
branch replication (Section ![]() ) and apply/return
inlining (Section
) and apply/return
inlining (Section ![]() ) were not successful. It was
only when we resorted to the much less portable branch inlining that
we improved the performance of virtual branches significantly. Second,
the slowdown observed amongst a few Tcl benchmarks (which dispatched
very few virtual instructions) raises the concern that even the load
time overhead of subroutine threading may be too high. This suggests
that we should investigate lazy approaches so we can delay generating
code until it is needed.
) were not successful. It was
only when we resorted to the much less portable branch inlining that
we improved the performance of virtual branches significantly. Second,
the slowdown observed amongst a few Tcl benchmarks (which dispatched
very few virtual instructions) raises the concern that even the load
time overhead of subroutine threading may be too high. This suggests
that we should investigate lazy approaches so we can delay generating
code until it is needed.
These results inform our design of a gradually extensible interpreter, to be presented next. We suggested, in cha:introduction, that a JIT compiler would be simpler to build if its code generator has the option of falling back on calling virtual instruction bodies. The resulting fall back code is very similar to code generated at load time by a subroutine-threaded interpreter. In this chapter we have seen that linear sequences of virtual instructions program can be efficiently dispatched using subroutine threading. This suggests that there would be little or no performance penalty, relative to interpretation, when a JIT falls back on calling sequences of virtual instructions that it chooses not to compile.
We have shown that dispatching virtual branch instructions efficiently can gain 5% or more performance. We have shown that branch inlining, though not portable, is an effective way of reducing branch mispredictions. However, our experience has been that branch inlining is time consuming to implement. In the next chapter we will show that identifying hot interprocedural paths, or traces, at runtime enables a much simpler way of dealing with virtual branches that performs as well as branch inlining.