

World Community Grid
World Community Grid is a public, high-performance computing platform available for "open science/open data" research that benefits humanity. WCG has been created and funded by a philanthropic initiative of IBM Corporate Social Responsibility since 2004 till 2021, to empower anyone with a computer, Android or Raspberry Pi device to contribute to research on health and sustainability. Check out our Youtube Channel, where you can find videos such as; How World Community Grid works and How can World Community Grid transform scientific research.
WCG embraces open-source and open-data sharing policy. The policy contributes to collaborative and reproducible science. Access to data is a significant factor driving science today. So far WCG has generated over a petabyte of data, available freely to the global research community. Our scientific and contributing partners include: Scripps Research, Harvard University, The University of Texas Medical Branch, Pierre et Marie Curie University, University of Washington, Chiba Cancer Center Research Institute, University of Cape Town, UMDNJ-Robert Wood Johnson Medical School and The Cancer Institute of New Jersey, Institute for Systems Biology, New York University, Georgia Tech and many others.
WCG meets important security standards. Following security by design principles, the physical servers are located within a managed services environment which follows the Compute Canada security standards, and communication with client-side machines are secured using private digital keys.
WCG uses Berkeley Open Infrastructure for Network Computing (BOINC) clients, built at U Berkeley, and tested by over 4 million volunteers since 1995. BOINC is used world-wide by over 45 projects, including: ERN (LHC@Home), University of Washington (Rosetta@Home), Max Planck Institute for Graviational Physics - Hanover (Einstein@Home), Rensselaer Polytechnic Institute (Milkyway@Home), Oxford University (ClimatePrediction.net).
We strive to make the world a better and healthier place for all of humanity. Our mission is to accelerate science by creating a supercomputer empowered by a global community of volunteers. Ultimately, our volunteers and partners have helped create an impressive global - yet individually driven - people's supercomputer!

Software and portals for integrative computational biology analysis and modeling
Our focus is on network analysis and modeling, integrated with cancer profiles that will enable us to identify diagnostic and prognostic biomarkers, understand disease initiation and progression, which will lead to improving cancer treatment. Our tools and resources include diverse network portals (IID [I2D, OPHID], mirDIP, Catrin, pathDIP, GAP), disease data portals (CDIPliver, OsteoDIP, PsDIP, NephroDIP, NeuroDIP), prediction and network visualization tools (FpClass, NAViGaTOR), drug discovery algorithms and portals (CMapBatch, NetworRx), prediction and graph theory algorithms (miRAnno, USNAP, SDREGION, Temp-O, RNSC), analysis and visualization tools (GSOAP, BIP, RQSA, BTSVQ). Combined or individually, these tools enable users to analyze, integrate and interpret multi-omics datasets and create relevant explainable disease models.
Data portals and algorithms have been instrumental in many clinical and preclinical studies, including those in arthritis (e.g., PMID: 38267619, 37894979, 37532285, 35791923, 36474475, 35321117, 35157043, 34803912, 34669443, 34588660, 33303908, 32738291, 36741392), brain research (e.g., PMID: 38350995, 35852739, 35172120, 34897024, 32357304), cancer (e.g., PMID: 37478172, 34881186, 34072436, 33142239, 32443704, 32015424, 31980649, 31780666, 30922393, 36815540, 30912767, 30796022, 30659026, 30222135, 29507679, 29483644, 28766011, 28174235, 27956147), immunology (e.g., PMID: 38444851, 35264564, 34645905, 34255742, 36597912, 36238301), and transplant (e.g., PMID: 38446901, 34557585, 34033948, 33863738, 32900843, 32453760, 30801542).
IID - Integrated Interactions Database
IID is the first database providing tissue-specific protein-protein interactions (PPIs) for model organisms (yeast, worm, fly, rat, mouse) and human, providing access to 1,421,199 human protein interactions covering 20,147 proteins, annotated with 133 tissues and 92 diseases (PMID: 34755877, 34902122, 33262342, 30407591, 29220074). IID was expanded through the collaboration with high-throughput biologists, application to tissue-specific and disease-specific context (e.g., PMID: 35156780, 34606829, 34881186, 32415080, 32357304, 31980649, 31780666, 28766011, 28298427, 28065597, 27956147), and as part of international IMEx consortium of PPI curated databases (e.g., PMID: 33262342, 33206959, 30602777, 29642841). These analyses led to tissue- and disease-specific models and validated insights (e.g., PMID: 28766011, 31780666, 30912767, 32357304, 30659026).
IID is an active member of IMEx consortium, which has been included in the Global Biodata Coalition (GBC) in 2023. Discontinuation of GBC resources would have a highly detrimental impact on the global research endeavour; and there are only 52 such critical biodata resources worldwide.
Kotlyar M, Pastrello C, Abovsky M, Mizeranschi A, Keating A, Cameron LC, Chandran V, Jurisica I. IID 2025: Physical protein interaction data with detection types, co-purified protein sets, molecular docking, and immune cell networks. Nucleic Acids Res. 54(D1):D593-D600, 2026.Kotlyar M, Pastrello C, Ahmed Z, Chee J, Varyova Z, Jurisica I, IID 2021: Towards context-specific protein interaction analyses by increased coverage, enhanced annotation and enrichment analysis. Nucl Acids Res, 50(D1):D640-D647, 2022.
Kotlyar, M., Pastrello, C., Malik, Z., Jurisica, I., IID 2018 update: context-specific physical protein-protein interactions in human, model organisms and domesticated species. Nucl Acids Res, 47(D1):D581-D589, 2019.
Kotlyar M, Pastrello C, Sheahan N, Jurisica I. Integrated interactions database: tissue-specific view of the human and model organism interactomes. Nucl Acids Res, 44(D1):D536-41, 2016.
Kotlyar, M, Wong, SWH, Pastrello, C, Jurisica, I. Improving Analysis and Annotation of Microarray Data with Protein Interactions. Ed. G. Agapito. Microarray Data Analysis, Methods Mol Biol, vol. 2401: 51-68, 2022.
Pastrello C, Kotlyar M, Jurisica I., Informed Use of Protein-Protein Interaction Data: A Focus on the Integrated Interactions Database (IID). Methods Mol Biol., 2074:125-134, 2020.
Hauschild, A-C, Pastrello, C, Kotlyar, M and Jurisica, I. Protein-protein interaction data, their quality, and major public databases. Ed. N. Przulj. Analyzing Network Data in Biology and Medicine, An Interdisciplinary Textbook for Biological, Medical and Computational Scientists, Cambridge University Press, Cambridge, UK, pp.151-192, 2019.
Go to IID home page
mirDIP - microRNA:target prediction Data Integration Portal
mirDIP is an on-line database that integrates thirty microRNA resources, providing nearly 152 million human microRNA:target predictions. We also introduce an integrative score, which was statistically inferred from the obtained predictions, and was assigned to each unique microRNA:target interaction to provide a unified measure of confidence. We demonstrate that integrating predictions across multiple resources does not cumulate prediction bias towards biological processes or pathways. In version 5.2, we removed eight outdated resources, added a new resource (miRNATIP), and ran five prediction algorithms for miRBase and mirGeneDB. In total, mirDIP 5.2 includes 46,364,047 predictions for 27,936 genes and 2,734 microRNAs, making it the first database to provide interactions using data from mirGeneDB. Moreover, we curated and integrated 32,497 novel microRNAs from 14 publications to accelerate the use of these novel data.
Houschild AC, Pastrello C, Ekaputeri GKA, Bethune-Waddell D, Abovsky M, Ahmed Z, Kotlyar M Lu R, Jurisica I. MirDIP 5.2: tissue context annotation and novel microRNA curation, Nuncl Acids Res, 51(D1):D217-D225, 2023.
Tokar T, Pastrello C, Abovsky M, Rahmati S, Jurisica I. miRAnno—network-based functional microRNA annotation, Bioinformatics, 38(2):592–593, 2022.
Tokar, T., Pastrello, C., Rossos, A., Abovsky, M., Hauschild, A.C., Tsay, M., Lu, R., Jurisica, I. mirDIP 4.1 – Integrative database of human microRNA target predictions, Nucl Acids Res, 46(D1): D360-D370, 2018.
Shirdel EA, Xie W, Mak TW, Jurisica I. NAViGaTing the micronome - using multiple microRNA prediction databases to identify signalling pathway-associated microRNAs. PLoS One. 6(2):e17429, 2011.
Go to mirDIP home page
MirDIP 5 has also extended content and functionality by associating contexts with microRNAs, genes, and microRNA-gene interactions. It includes curated microRNA and gene expression data from 20 resources and information on 330 tissue and disease contexts for 2,657 microRNAs, 27,576 genes and 123,651,910 gene-microRNA-tissue interactions. MirDIP 5 has also improved usability by enabling the user to search the database using precursor IDs. miRAnno (PMID: 34297061) is now integrated into mirDIP, which enables a network-based identification of pathways linked to specific microRNAs. MirDIP API facilitates access to integrated predictions. In addition, users can now analyze their results using Drugst.One, where a drug-gene network is created using only the user’s genes in a specific pathway.
Houschild AC, Pastrello C, Ekaputeri GKA, Bethune-Waddell D, Abovsky M, Ahmed Z, Kotlyar M Lu R, Jurisica I. MirDIP 5.2: tissue context annotation and novel microRNA curation, Nuncl Acids Res, 51(D1):D217-D225, 2023.
Tokar T, Pastrello C, Abovsky M, Rahmati S, Jurisica I. miRAnno—network-based functional microRNA annotation, Bioinformatics, 38(2):592–593, 2022.
Tokar, T., Pastrello, C., Rossos, A., Abovsky, M., Hauschild, A.C., Tsay, M., Lu, R., Jurisica, I. mirDIP 4.1 – Integrative database of human microRNA target predictions, Nucl Acids Res, 46(D1): D360-D370, 2018.
Shirdel EA, Xie W, Mak TW, Jurisica I. NAViGaTing the micronome - using multiple microRNA prediction databases to identify signalling pathway-associated microRNAs. PLoS One. 6(2):e17429, 2011.
Go to mirDIP home page
Catrin - Catalogue of Transcriptional Regulatory Interactions
Accurate identification of associations between transcription factors and their target genes is one of the fundamental challenges in molecular biology. A variety of methods, including low- and high-throughput assays, gene regulatory networks inference algorithms and machine learning tools have been applied to determine these associations, producing large amounts of data.
Catrin integrates ~13.2 million unique transcription factor:target gene associations, involving 2,871 putative transcription factors and covering nearly 25 thousand genes. In addition to the web interface, Catrin provides programmatic access via API, to maximize utilization of this database.
Go to Catrin home page
Catrin integrates ~13.2 million unique transcription factor:target gene associations, involving 2,871 putative transcription factors and covering nearly 25 thousand genes. In addition to the web interface, Catrin provides programmatic access via API, to maximize utilization of this database.
Endisha H, Datta P, Sharma A, Nakamura S, Rossomacha E, Younan C, Ali SA, Tavallaee G, Lively S, Potla P, Shestopaloff K, Rockel JS, Krawetz R, Mahomed NN, Jurisica I, Gandhi R, Kapoor M. MicroRNA-34a-5p Promotes Joint Destruction During Osteoarthritis. Arthritis Rheumatol. 2021 Mar;73(3):426-439. doi: 10.1002/art.41552. Epub 2021 Feb 8. PMID: 33034147; PMCID: PMC7986901.
Tavallaee G, Lively S, Rockel JS, Ali SA, Im M, Sarda C, Mitchell GM, Rossomacha E, Nakamura S, Potla P, Gabrial S, Matelski J, Ratneswaran A, Perry K, Hinz B, Gandhi R, Jurisica I, Kapoor M. Contribution of MicroRNA-27b-3p to Synovial Fibrotic Responses in Knee Osteoarthritis. Arthritis Rheumatol. 2022 Dec;74(12):1928-1942. doi: 10.1002/art.42285. Epub 2022 Nov 11. PMID: 35791923; PMCID: PMC10946865.
França TT, Al-Sbiei A, Bashir G, Mohamed YA, Salgado RC, Barreiros LA, Maria da Silva Napoleão S, Weber CW, Fernandes Severo Ferreira J, Aranda CS, Prando C, de Barros Dorna MB, Jurisica I, Fernandez-Cabezudo MJ, Ochs HD, Condino-Neto A, Al-Ramadi BK, Cabral-Marques O. CD40L modulates transcriptional signatures of neutrophils in the bone marrow associated with development and trafficking. JCI Insight. 2021 Aug 23;6(16):e148652. doi: 10.1172/jci.insight.148652. PMID: 34255742; PMCID: PMC8410015.
Chakraborty M, Chu K, Shrestha A, Revelo XS, Zhang X, Gold MJ, Khan S, Lee M, Huang C, Akbari M, Barrow F, Chan YT, Lei H, Kotoulas NK, Jovel J, Pastrello C, Kotlyar M, Goh C, Michelakis E, Clemente-Casares X, Ohashi PS, Engleman EG, Winer S, Jurisica I, Tsai S, Winer DA. Mechanical Stiffness Controls Dendritic Cell Metabolism and Function. Cell Rep. 2021 Jan 12;34(2):108609. doi: 10.1016/j.celrep.2020.108609. PMID: 33440149.
D'Angelo E, Pastrello C, Biccari A, Marangio A, Sensi F, Crotti S, Fassan M, Jurisica I, Pucciarelli S, Agostini M. An integrated multiomics analysis of rectal cancer patients identified POU2F3 as a putative druggable target and entinostat as a cytotoxic enhancer of 5-fluorouracil. Int J Cancer. 2023 Jul 15;153(2):437-449. doi: 10.1002/ijc.34478. Epub 2023 Mar 23. PMID: 36815540.
McEvoy CM, Clotet-Freixas S, Tokar T, Pastrello C, Reid S, Batruch I, RaoPeters AAE, Kaths JM, Urbanellis P, Farkona S, Van JAD, Urquhart BL, John R, Jurisica I, Robinson LA, Selzner M, Konvalinka A. Normothermic Ex-vivo Kidney Perfusion in a Porcine Auto-Transplantation Model Preserves the Expression of Key Mitochondrial Proteins: An Unbiased Proteomics Analysis. Mol Cell Proteomics. 2021;20:100101. doi: 10.1016/j.mcpro.2021.100101. Epub 2021 May 23. PMID: 34033948; PMCID: PMC8253910.
Clotet-Freixas S, Zaslaver O, Kotlyar M, Pastrello C, Quaile AT, McEvoy CM, Saha AD, Farkona S, Boshart A, Zorcic K, Neupane S, Manion K, Allen M, Chan M, Chen X, Arnold AP, Sekula P, Steinbrenner I, Köttgen A, Dart AB, Wicklow B, McGavock JM, Blydt-Hansen TD, Barrios C, Riera M, Soler MJ, Isenbrandt A, Lamontagne-Proulx J, Pradeloux S, Coulombe K, Soulet D, Rajasekar S, Zhang B, John R, Mehrotra A, Gehring A, Puhka M, Jurisica I, Woo M, Scholey JW, Röst H, Konvalinka A. Sex differences in kidney metabolism may reflect sex-dependent outcomes in human diabetic kidney disease. Sci Transl Med. 2024 Mar 6;16(737):eabm2090. doi: 10.1126/scitranslmed.abm2090. Epub 2024 Mar 6. PMID: 38446901.
Akihiro Nakamura, Sungsin Jo, Sayaka Nakamura, Ye-Soo Park, Himanshi Gupta, Sandra Vijayan, Jason S. Rockel, Mohit Kapoor, Igor Jurisica, Tae-Hwan Kim, Nigil Haroon. Interacting with MIF enhances neutrophil-driven type 3 immunity and chondrogenesis in murine spondyloarthritis, Cellular & Molecular Immunology, In press.
Go to Catrin home page
pathDIP - An annotated resource for known and predicted human gene-pathway associations and pathway enrichment analysis
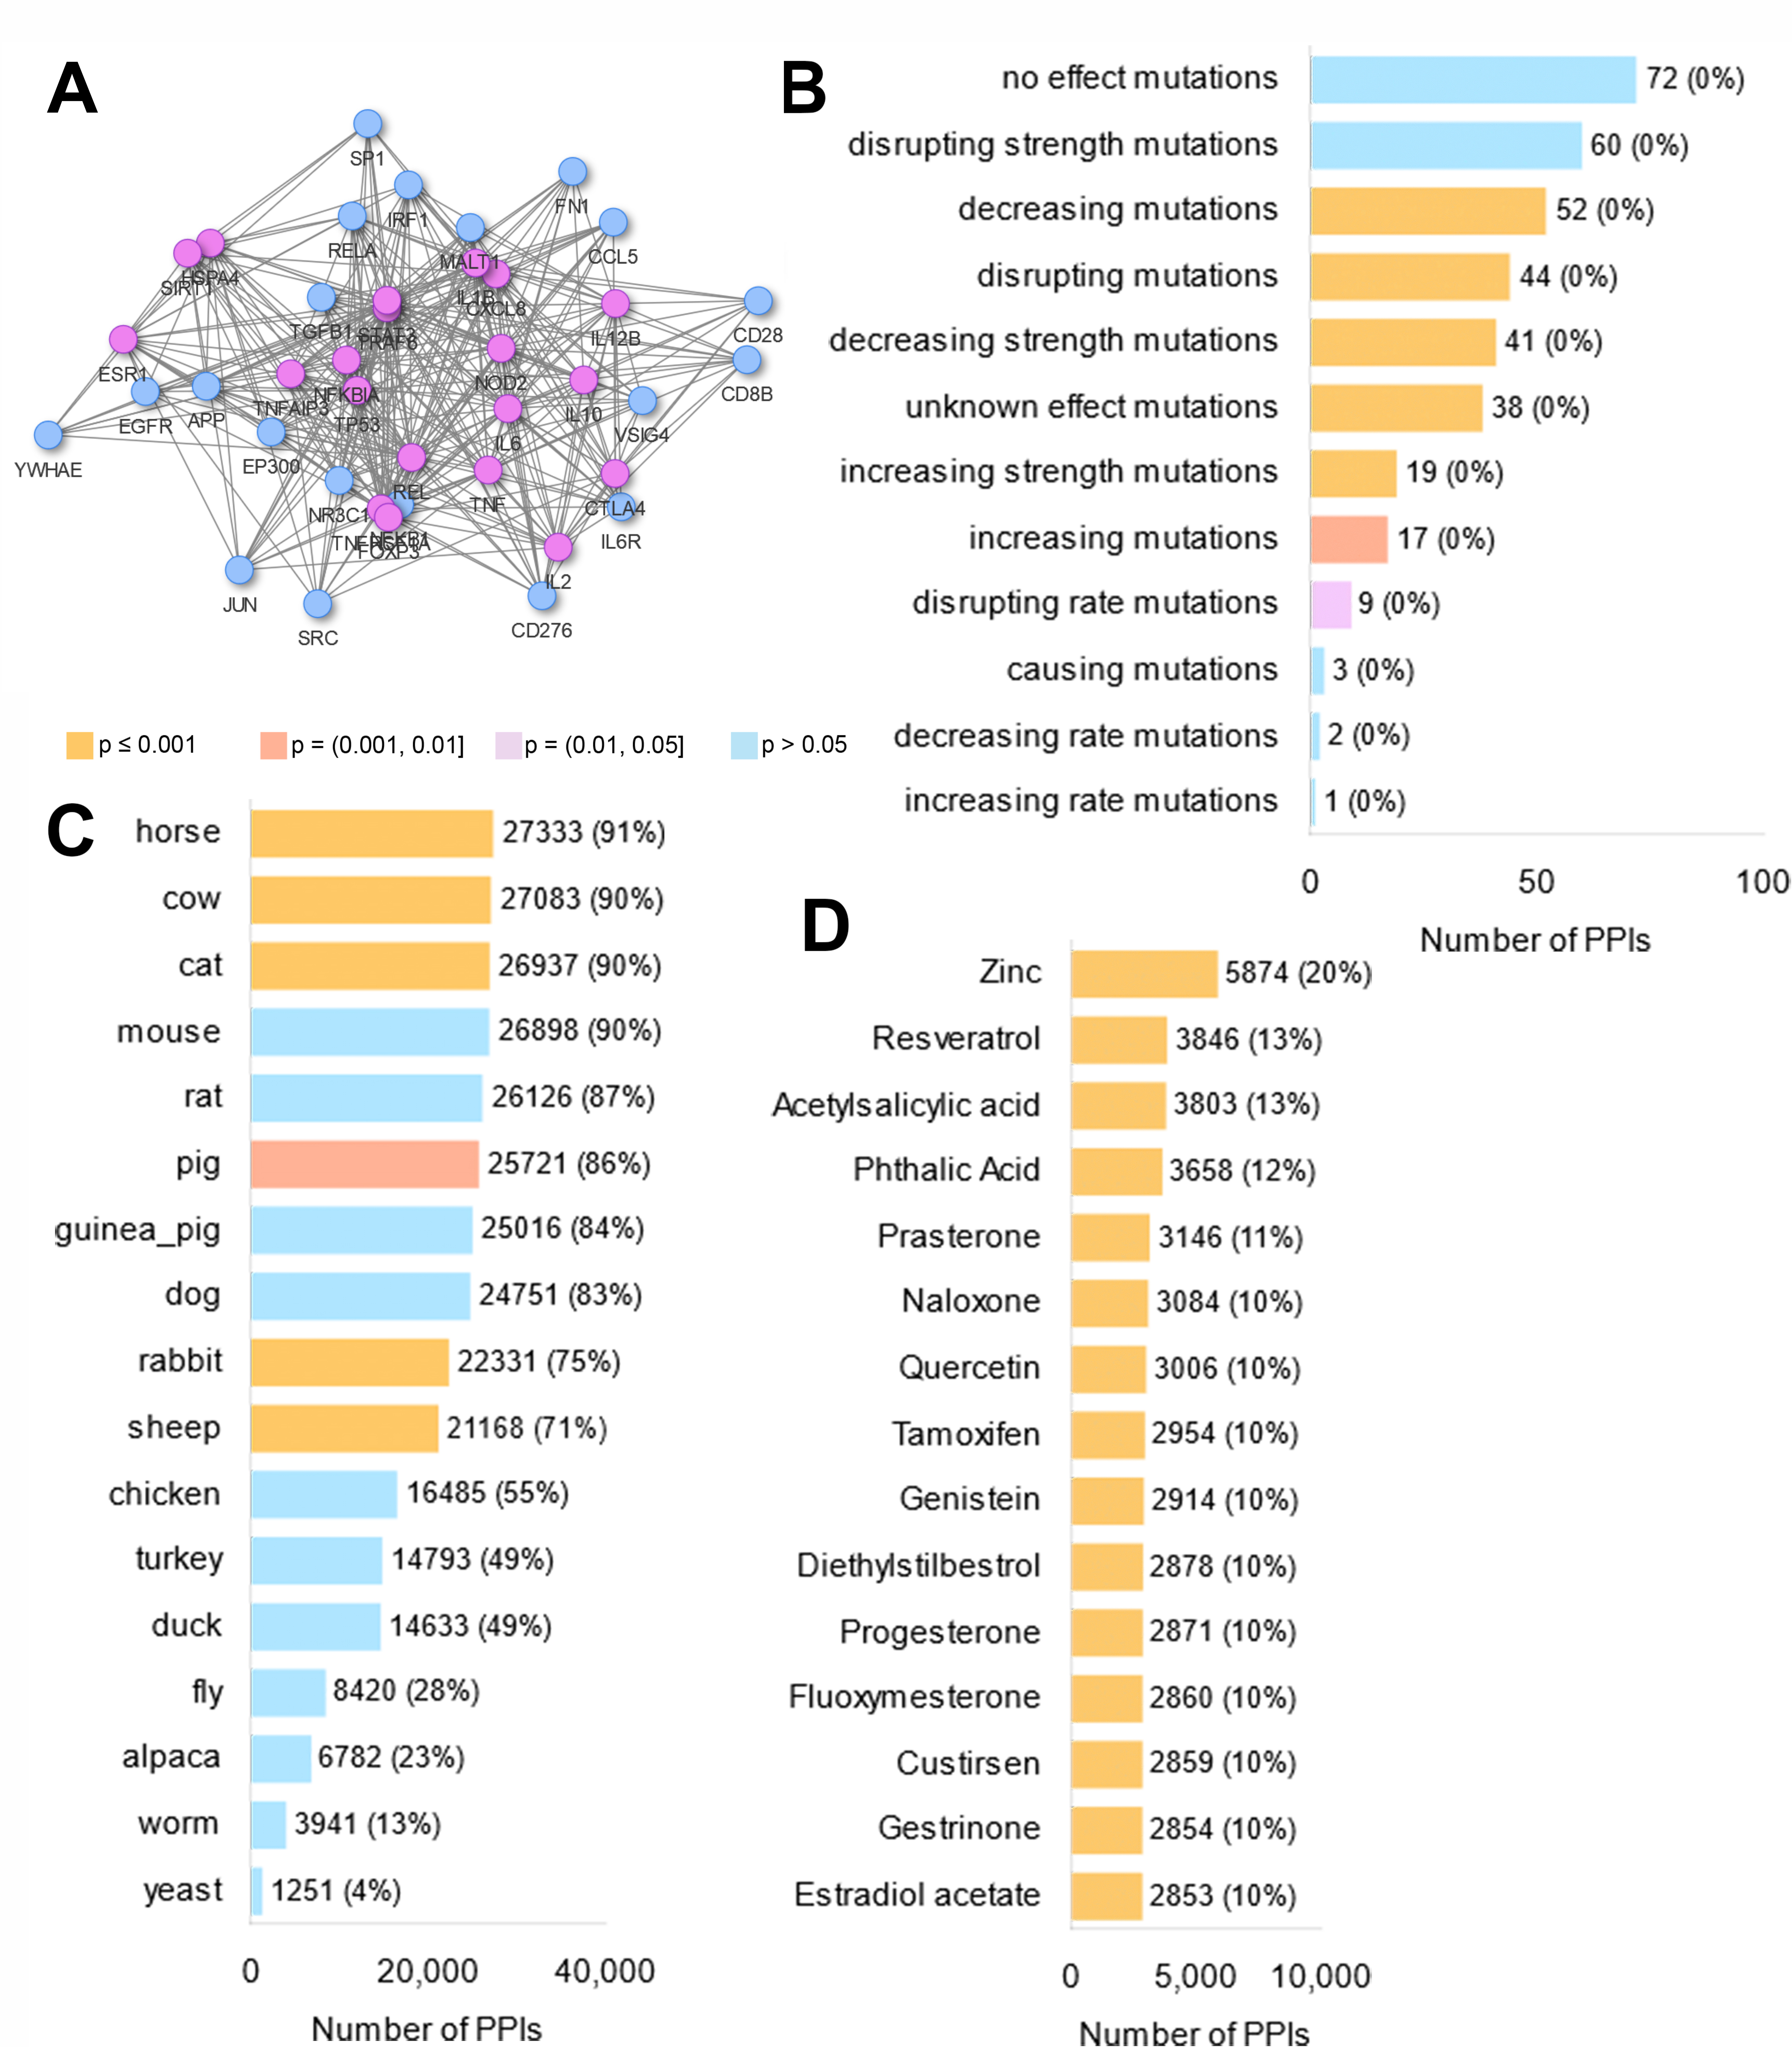
pathDIP integrates data from twenty source pathway databases - "core pathways" - with physical protein-protein interactions (PPIs) from IID to predict biologically relevant protein-pathway associations, i.e., "extended pathways". Cross-validation determined 78% recovery rate of our predictions (randomization test, p-value; 0.0001). Data integration and predictions increase coverage of pathway annotations for protein-coding genes to 86% from 57%. pathDIP annotates 18,144 protein coding genes; 2.5 and 2.2 times larger than coverage of KEGG and Reactome, individually.
Pastrello, C, Niu, Y, Jurisica, I. Pathway Enrichment Analysis of Microarray Data. Ed. G. Agapito. Microarray Data Analysis, Methods Mol Biol, vol. 2401: 147-159, 2022.
G. Agapito, Y. Niu, C. Pastrello, I. Jurisica. Pathway integration and annotation: building a puzzle with non-matching pieces and no picture to follow, Briefings in Bioinformatics, 23(5):bbac368, 2022.
Agapito, G., Pastrello, C., Jurisica, I. Comprehensive pathway enrichment analysis workflows: Covid-19 case study, Briefings Bioinform, 22(2): 676-689, 2021.
Rahmati, S., Abovsky, M., Pastrello, C., Kotlyar, M., Lu, R., Cumbaa, C.A., Rahman, P., Chandran, V. and Jurisica, I. pathDIP 4: An extended pathway annotations and enrichment analysis resource for human, model organisms and domesticated species, Nucl Acids Res, 48(D1): D479–D488, 2020.
Agapito G, Pastrello C, Guzzi PH, Jurisica I, Cannataro M. BioPAX-Parser: parsing and enrichment analysis of BioPAX pathways, Bioinformatics, 36(15):4377-4378, 2020.
Rahmati, S., Abovsky, M., Pastrello, C., Jurisica, I. pathDIP: An annotated resource for known and predicted human gene-pathway associations and pathway enrichment analysis. Nucl Acids Res, 45(D1): D419-D426, 2017.
Rahmati, S., Pastrello, C., Rossos, A., Jurisica, I. Two Decades of Biological Pathway Databases: Results and Challenges, In: Ranganathan, S., Nakai, K., Schönbach C. and Gribskov, M. (eds.), Encyclopedia of Bioinformatics and Computational Biology, vol. 1, pp. 1071–1084. Oxford: Elsevier, 2018.
Agapito, G., Pastrello, C., Jurisica, I. Comprehensive pathway enrichment analysis workflows: Covid-19 case study, Briefings Bioinform, 22(2): 676-689, 2021.
Pastrello, C, Niu, Y, Jurisica, I. Pathway Enrichment Analysis of Microarray Data. Ed. G. Agapito. Microarray Data Analysis, Methods Mol Biol, vol. 2401: 147-159, 2022.
Go to pathDIP home page
PathDIP 5 provides consolidation for 6,535 human-curated pathways across 12 databases using 7 types and 53 ontological categories. It extends pathway annotation to 3,236 human pathway orphans and includes 5,783 metabolites across species. In addition to enrichment analysis, users can now analyze their results using Drugst.One, where a drug-gene network is created using only the user’s genes in a specific pathway.
Pastrello C, Kotlyar M, Abovsky M, Lu R, Jurisica I. PathDIP 5: improving coverage and making enrichment analysis more biologically meaningful. Nucleic Acids Res, 52(D1):D663-D671, 2024.Pastrello, C, Niu, Y, Jurisica, I. Pathway Enrichment Analysis of Microarray Data. Ed. G. Agapito. Microarray Data Analysis, Methods Mol Biol, vol. 2401: 147-159, 2022.
G. Agapito, Y. Niu, C. Pastrello, I. Jurisica. Pathway integration and annotation: building a puzzle with non-matching pieces and no picture to follow, Briefings in Bioinformatics, 23(5):bbac368, 2022.
Agapito, G., Pastrello, C., Jurisica, I. Comprehensive pathway enrichment analysis workflows: Covid-19 case study, Briefings Bioinform, 22(2): 676-689, 2021.
Rahmati, S., Abovsky, M., Pastrello, C., Kotlyar, M., Lu, R., Cumbaa, C.A., Rahman, P., Chandran, V. and Jurisica, I. pathDIP 4: An extended pathway annotations and enrichment analysis resource for human, model organisms and domesticated species, Nucl Acids Res, 48(D1): D479–D488, 2020.
Agapito G, Pastrello C, Guzzi PH, Jurisica I, Cannataro M. BioPAX-Parser: parsing and enrichment analysis of BioPAX pathways, Bioinformatics, 36(15):4377-4378, 2020.
Rahmati, S., Abovsky, M., Pastrello, C., Jurisica, I. pathDIP: An annotated resource for known and predicted human gene-pathway associations and pathway enrichment analysis. Nucl Acids Res, 45(D1): D419-D426, 2017.
Rahmati, S., Pastrello, C., Rossos, A., Jurisica, I. Two Decades of Biological Pathway Databases: Results and Challenges, In: Ranganathan, S., Nakai, K., Schönbach C. and Gribskov, M. (eds.), Encyclopedia of Bioinformatics and Computational Biology, vol. 1, pp. 1071–1084. Oxford: Elsevier, 2018.
Agapito, G., Pastrello, C., Jurisica, I. Comprehensive pathway enrichment analysis workflows: Covid-19 case study, Briefings Bioinform, 22(2): 676-689, 2021.
Pastrello, C, Niu, Y, Jurisica, I. Pathway Enrichment Analysis of Microarray Data. Ed. G. Agapito. Microarray Data Analysis, Methods Mol Biol, vol. 2401: 147-159, 2022.
Go to pathDIP home page
CDIP - Cancer Data Integration Portal - Liver
CDIP is an on-line database of significantly deregulated genes in Liver, lung, ovarian, prostate and head&neck cancers. Work on pancreas cancer and sarcoma is ongoing.
Bhat, M. Elisa Pasini, Chiara Pastrello, Sarah Rahmati, Marc Angeli, Max Kotlyar, Anand Ghanekar and Igor Jurisica, Integrative Analysis of Layers of Data in Hepatocellular Carcinoma Reveals Pathway Dependencies, World J Hepatology, 13(1):94-108, 2021.
Bhat M, Pasini E, Pastrello C, Angeli M, Baciu C, Abovsky M, Coffee A, Adeyi O, Kotlyar M, Jurisica I., Estrogen Receptor 1 Inhibition of Wnt/β-catenin Signaling Contributes to Sex Differences in Hepatocarcinogenesis, Front Oncol. 11:777834, eCollection, 2021
Go to CDIPliver home page
OsteoDIP - Osteoarthritis Data Integration Portal
OsteoDIP is a database collecting and annotating osteoarthritis-specific omics data from human studies. The curation considered 1,204 papers and 28 data sets from GEO. The databese includes 1,924 patient samples. To ensure not only quality but high coverage as well, we opened the platform for contributed curation. OsteoDIP provides, for each gene of interest present in at least one of the curated papers, a set of annotation data from external databases. Disease annotation is collected from DisGeNET, protein secretion data from The Human Protein Atlas and MetazSecKB, SNPs from the GWAS Catalog, human protein:-protein interaction (PPI) data from the Integrated Interactions Database (IID) version ver. 2020-11 (with interaction annotations synovial macrophages, chondrocytes, growth plate cartilage, synovial membrane or articular cartilage). We also provide the number of conserved PPIs per species: conserved PPIs are determined by mapping experimentally detected human PPIs to orthologous protein pairs in 17 other species. Mappings are based on 1:1 orthologs from Ensembl release 100.
Pastrello C, Abovsky M, Lu R, Ahmed Z, Kotlyar M, Veillette C, Jurisica I, Osteoarthritis Data Integration Portal (OsteoDIP): A web-based gene and non-coding RNA expression database, Osteoarthritis and Cartilage Open, 4(1): 100237, 2022.
Ali SA, Pastrello C, Kaur N, Peffers MJ, Ormseth MJ, Jurisica I. A Network Biology Approach to Understanding the Tissue-Specific Roles of Non-Coding RNAs in Arthritis, Front Endocrinol (Lausanne), 12:744747, eCollection, 2021.
Go to OsteoDIP home page
FpClass - Data mining-based prediction of physical protein interactions
FpClass is an association mining algorithm that we used and validated for comprehensive, in silico prediction of physical protein interactions. FpClass is a reliable, validated method for data mining-based prediction of physical protein interactions, and provides 250,542 high confidence interactions among 10,529 human proteins, including 1,089 interactome orphans. Extensive computational and biological validation shows FpClass outperforms existing computational methods and most biological assays in sensitivity and specificity. Using three bioassays we tested 233 high and medium confidence predictions, and validated 137 interactions, including seven novel potential partners of the tumor suppressor p53.
Kotlyar M, Pastrello C, Pivetta F, Lo Sardo A, Cumbaa C, Li H, Naranian T, Niu Y, Ding Z, Vafaee F, Broackes-Carter F, Petschnigg J, Mills GB, Jurisicova A, Stagljar I, Maestro R, Jurisica I. In silico prediction of physical protein interactions and characterization of interactome orphans. Nat Methods.12(1):79-847, 2015.
Go to FpClass Supplemental data
Importantly, we validated 5 of these p53 interactions with orphans by GST pull-down assay (5 of 6 tested -- validation rate of 83%). Overall, validation rates were 40% (2/5) for co-IP, 47% (14/30) for GST pull-down, and 61% (121/198) for MaMTH (Petschnigg et al., Nat Methods, 2014). The high validation rate for MaMTH suggests that FpClass could help guide high-throughput screening, in a combined computational-experimental approach to interactome mapping. This substantially extends our interactome work, including I2D (Brown, Jurisica, Genome Biol, 2007) and (Brown, Jurisica, Bioinformatics, 2005). NAViGaTOR (Brown et al., Bioinformatics, 2009) was used for network analysis and visualization.
Kotlyar M, Pastrello C, Pivetta F, Lo Sardo A, Cumbaa C, Li H, Naranian T, Niu Y, Ding Z, Vafaee F, Broackes-Carter F, Petschnigg J, Mills GB, Jurisicova A, Stagljar I, Maestro R, Jurisica I. In silico prediction of physical protein interactions and characterization of interactome orphans. Nat Methods.12(1):79-847, 2015.
Go to FpClass Supplemental data
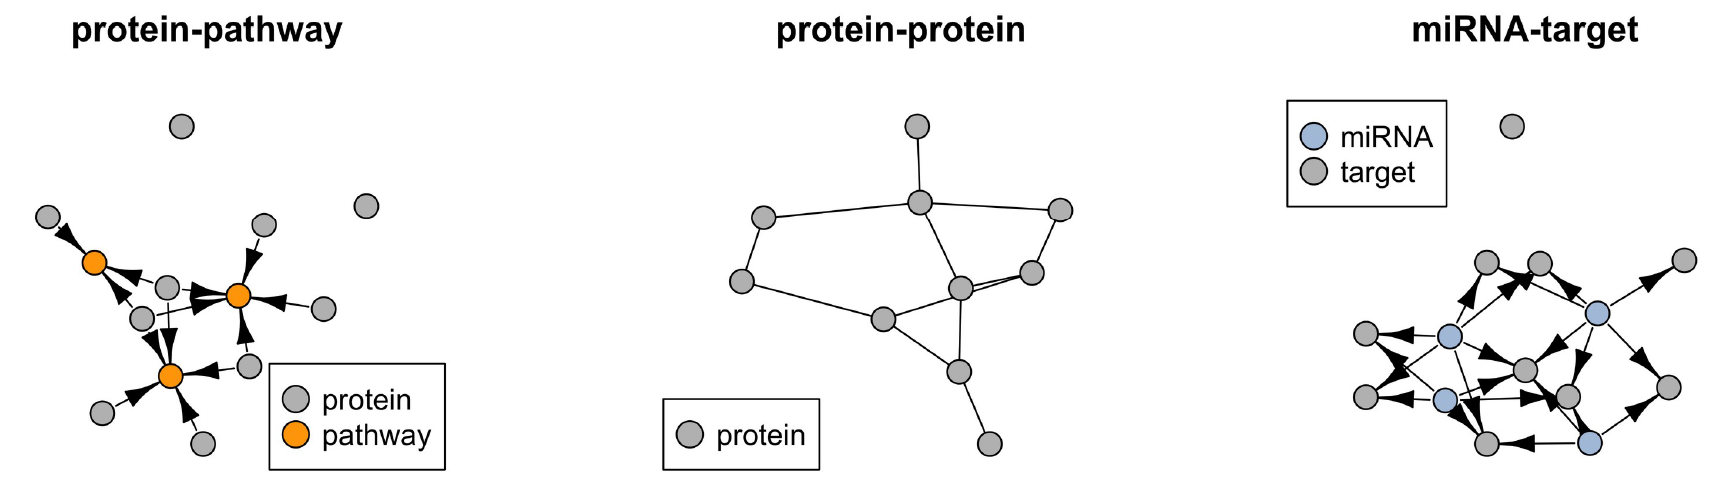
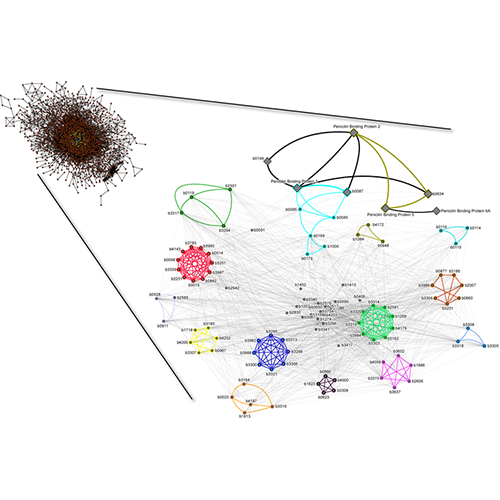
NAViGaTOR-Network Analysis, Visualization, & Graphing TORonto
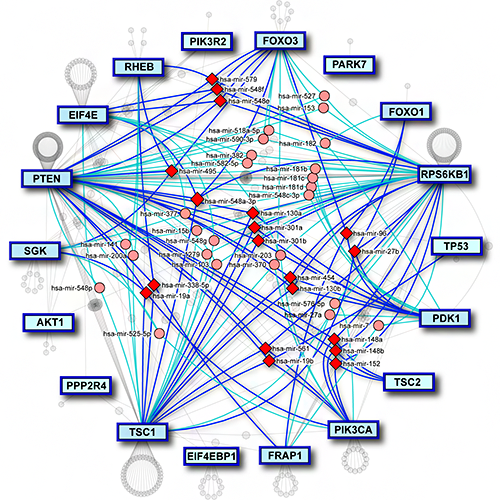
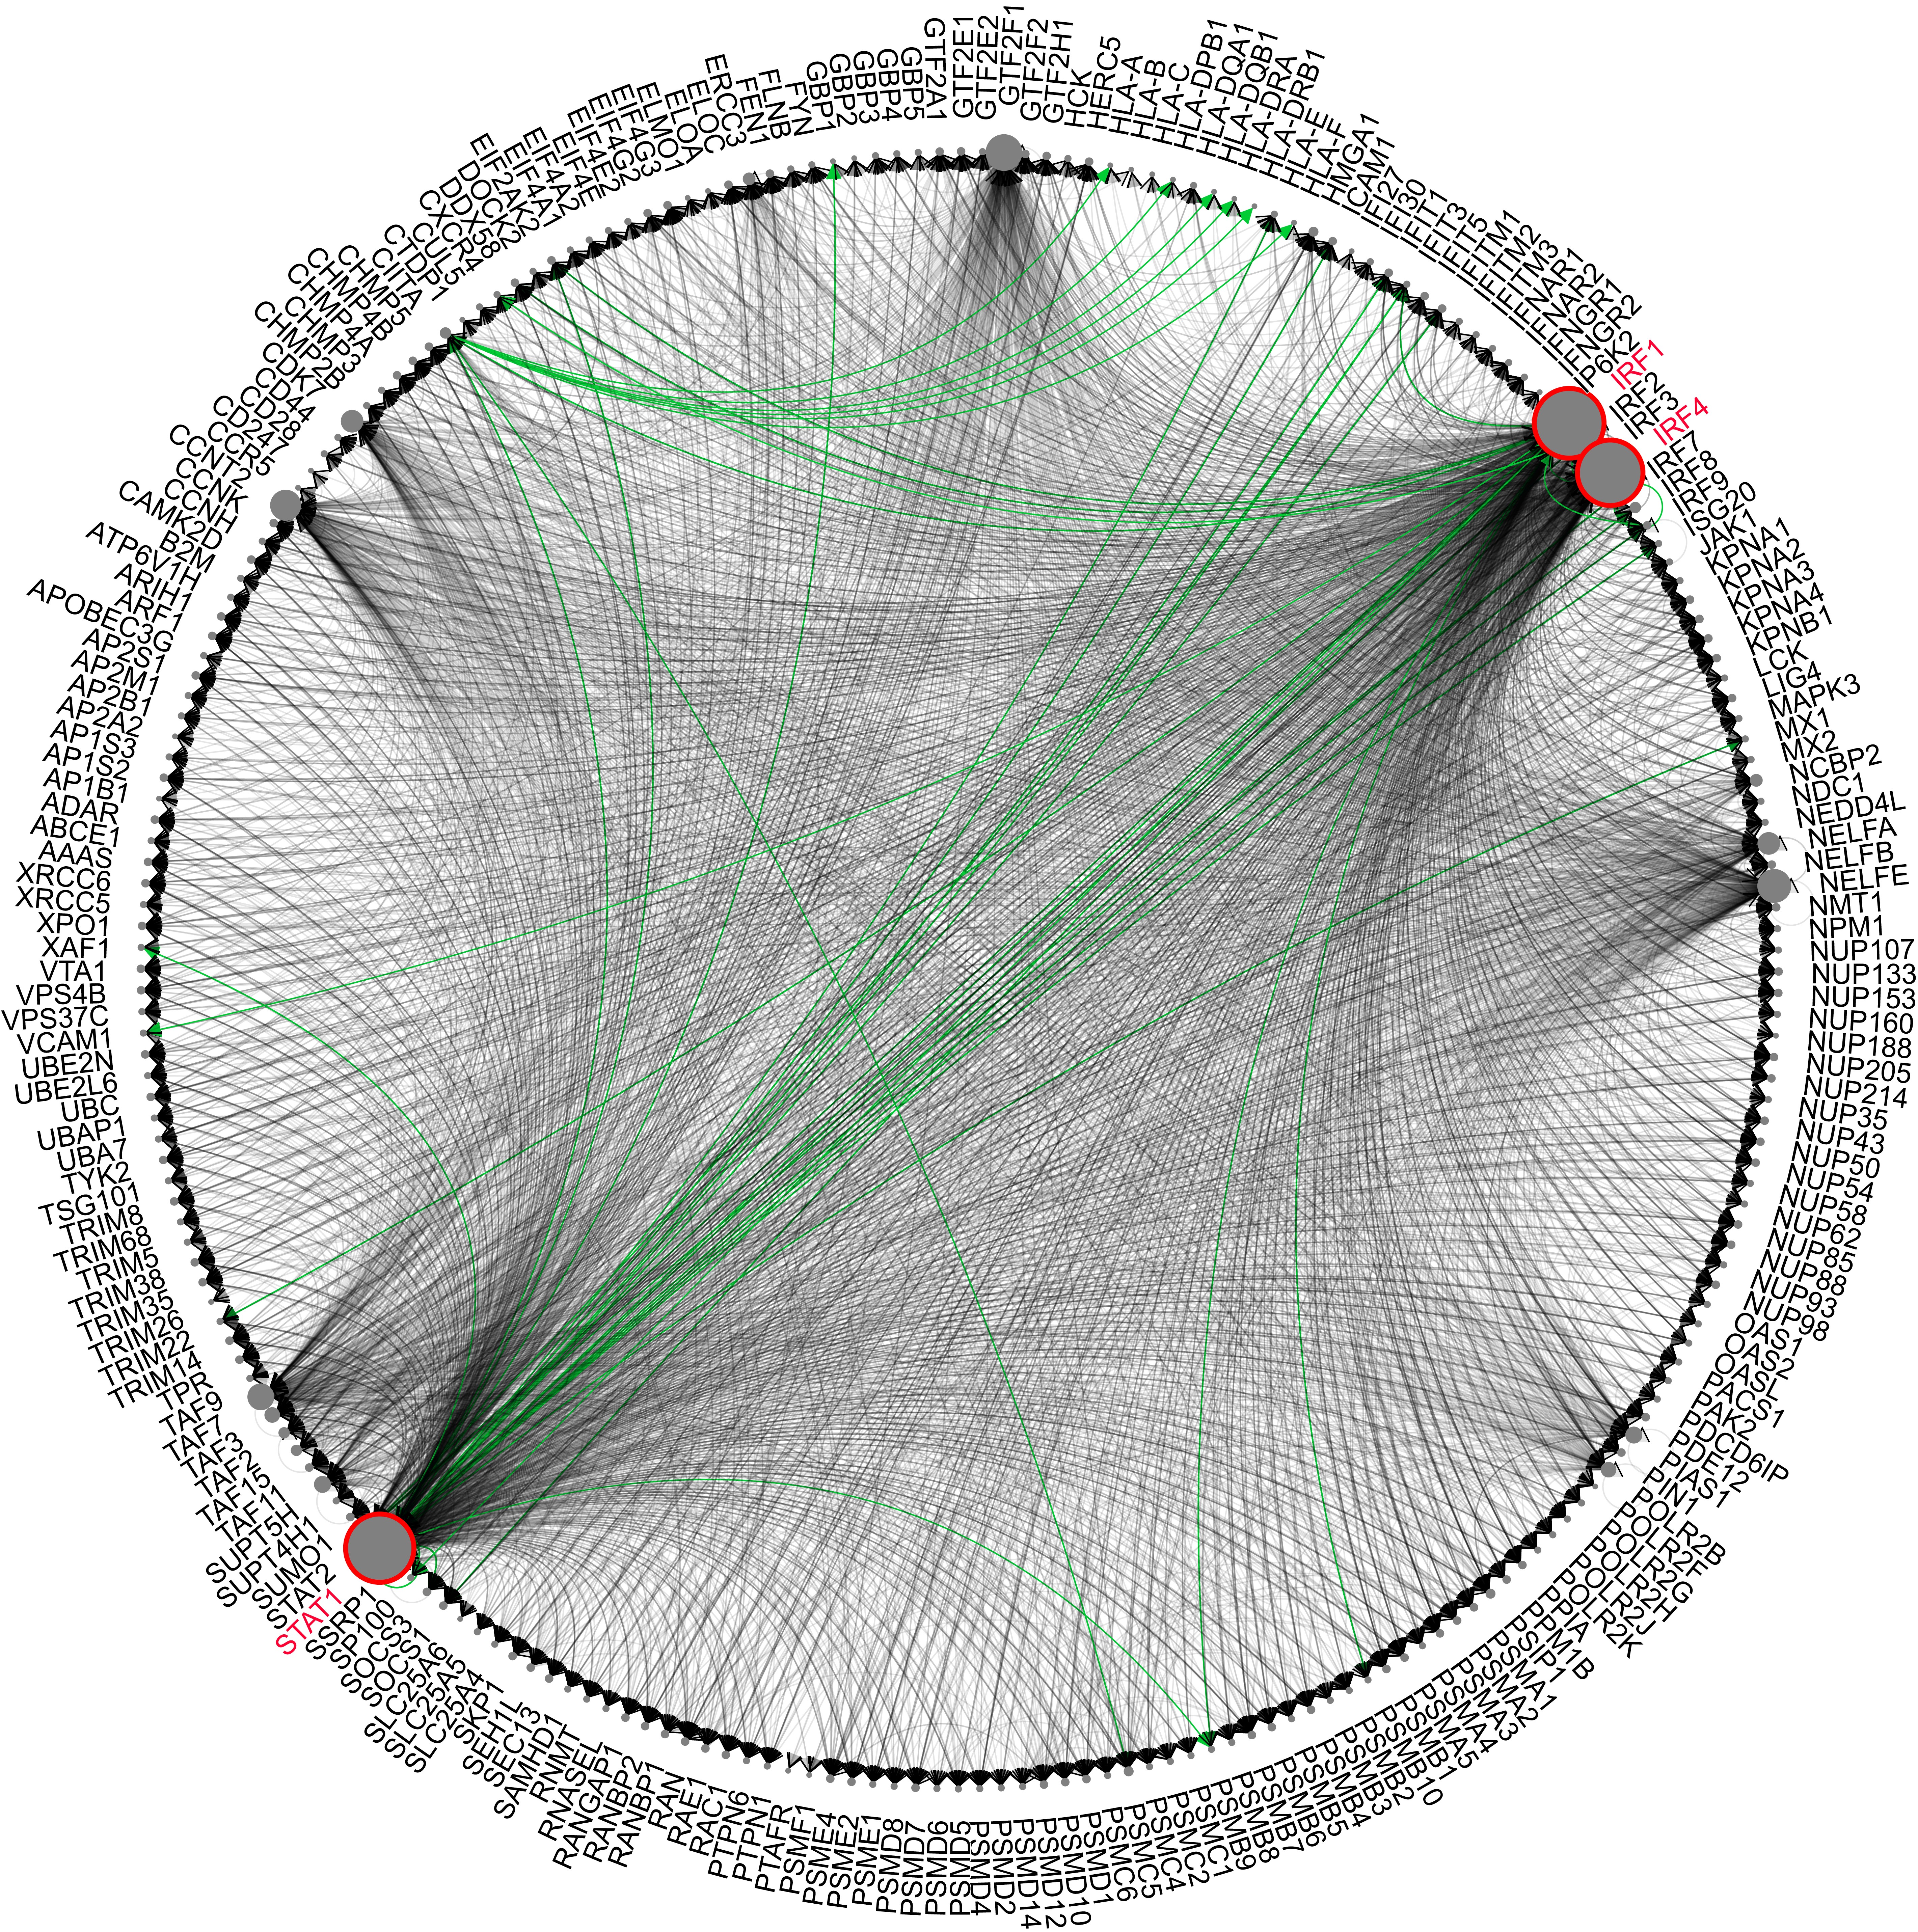
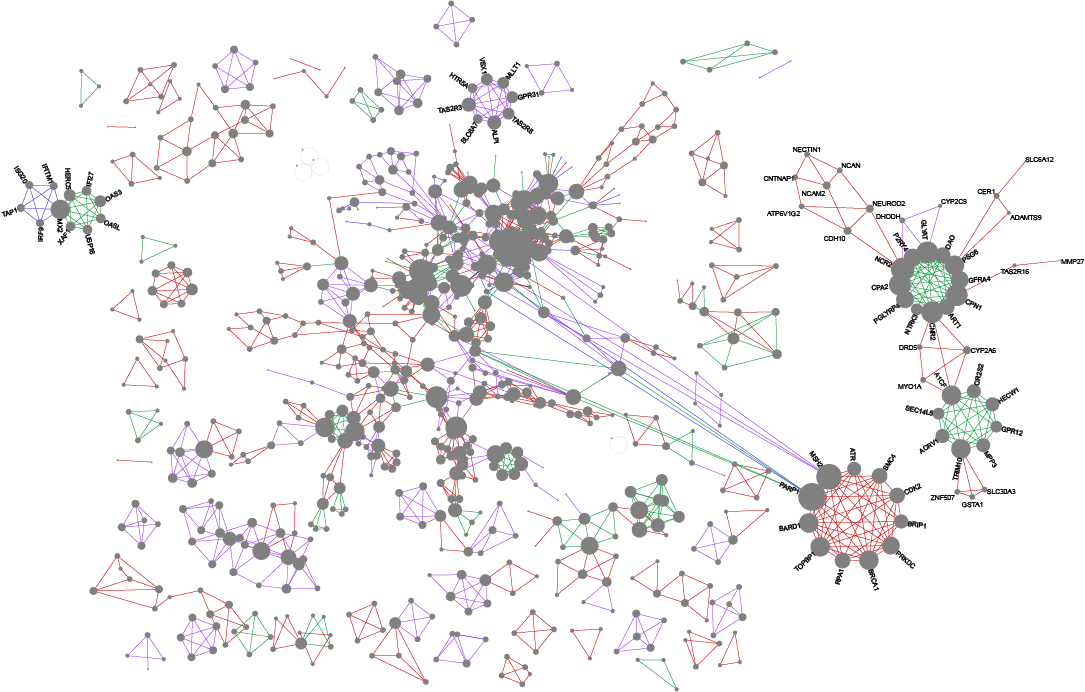
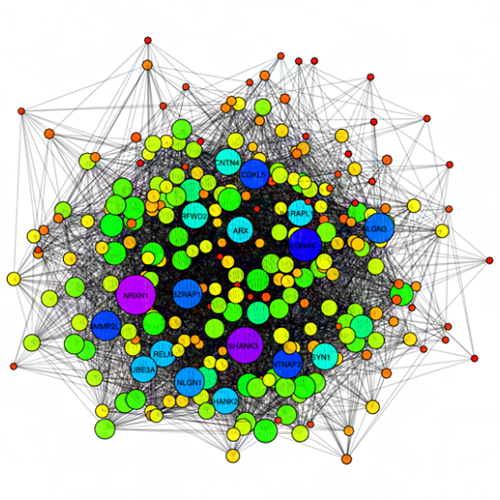
NAViGaTOR is a software package for scalable, interactive visual data mining - visualization and analysis of large, typed graphs. These networks could be protein-protein interaction networks, microRNA:gene or transcriptional regulatory networks, metabolic networks, or other graphs, such as transportationa networks, communication networks or even solar system. NAViGaTOR can query IID - online database of interaction data - as well as PSICQUIC, pathDIP, KEGG, Reactome and other data sources, as well as link annotation from Uniprot, GO, Pubmed, and display networks in 2D or 3D. To improve scalability and performance, NAViGaTOR combines Java with OpenGL to provide a 2D/3D visualization system on multiple hardware platforms. NAViGaTOR also provides analytical capabilities and supports standard import and export formats such as GO and the Proteomics Standards Initiative (PSI). In protein-protein interaction networks, nodes represent proteins, and edges between nodes represent physical interactions between the proteins.These visualizations can enable insights into the proteins that play key roles in diseases such as cancer.
Brown KR, Otasek D, Ali M, McGuffin MJ, Xie W, Devani B, Toch IL, Jurisica I. NAViGaTOR: Network Analysis, Visualization and Graphing Toronto. Bioinformatics. 25(24):3327-9, 2009.
Figure from: Benleulmi-Chaachoua A, Chen L, Sokolina K, Wong V, Jurisica I, Emerit MB, Darmon M, Espin A, Stagljar I, Tafelmeyer P, Zamponi GW, Delagrange P, Maurice P, Jockers R. Protein interactome mining defines melatonin MT1 receptors as integral component of presynaptic protein complexes of neurons. J Pineal Res. 60(1):95-108, 2016.
Hauschild, AC, Pastrello, C., Rossos, A., Jurisica, I. Visualization of Biomedical Networks, In: Ranganathan, S., Nakai, K., Schönbach C. and Gribskov, M. (eds.), Encyclopedia of Bioinformatics and Computational Biology, vol. 1, pp. 1016–1035. Oxford: Elsevier, 2018.
Go to NAViGaTOR home page
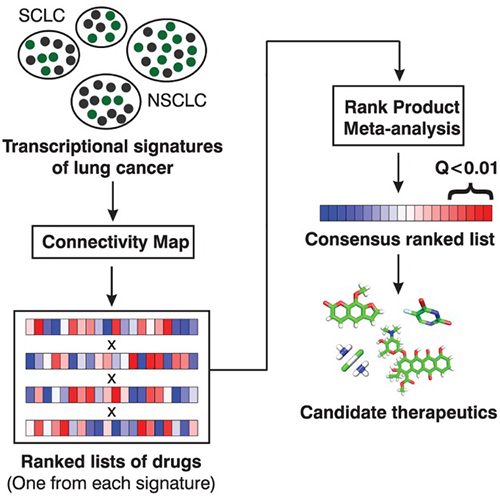
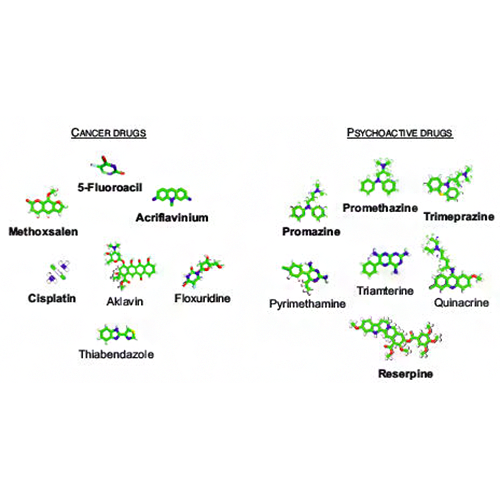
CMapBatch - A computational pipeline for drug repositioning
CMapBatch is computational pipeline that based on a set of disease signatures produces a list of drugs predicted to consistently reverse pathological gene changes. We have validated CMapBatch by conduct the largest and most systematic repurposing study on lung cancer transcriptomes, using 21 signatures. We show that scaling up transcriptional knowledge significantly increases the reproducibility of top drug hits, from 44% to 78%.
Fortney K, Griesman J, Kotlyar M, Pastrello C, Angeli M, Sound-Tsao M, Jurisica I. Prioritizing therapeutics for lung cancer: an integrative meta-analysis of cancer gene signatures and chemogenomic data. PLoS Comput Biol. 11(3):e1004068, 2015.
Go to CMapBatch home page
Fortney K, Griesman J, Kotlyar M, Pastrello C, Angeli M, Sound-Tsao M, Jurisica I. Prioritizing therapeutics for lung cancer: an integrative meta-analysis of cancer gene signatures and chemogenomic data. PLoS Comput Biol. 11(3):e1004068, 2015.
Go to CMapBatch home page
NetwoRx - A database for linking drugs to pathways and networks
NetwoRx stores pre-computed drug lists for KEGG pathways, GO categories, YEASTRACT transcription factor targets, and orthologs of human KEGG DISEASE groups. Users can interactively explore or download pathway-drug, pathwaypathway, and drug-drug networks, or submit a new gene set to NetwoRx and retrieve the drugs that target it.
Fortney K, Xie W, Kotlyar M, Griesman J, Kotseruba Y, Jurisica I. NetwoRx: connecting drugs to networks and phenotypes in Saccharomyces cerevisiae. Nucleic Acids Res. 41:D720-7, 2013
Go to NetwoRx home page
Fortney K, Xie W, Kotlyar M, Griesman J, Kotseruba Y, Jurisica I. NetwoRx: connecting drugs to networks and phenotypes in Saccharomyces cerevisiae. Nucleic Acids Res. 41:D720-7, 2013
Go to NetwoRx home page
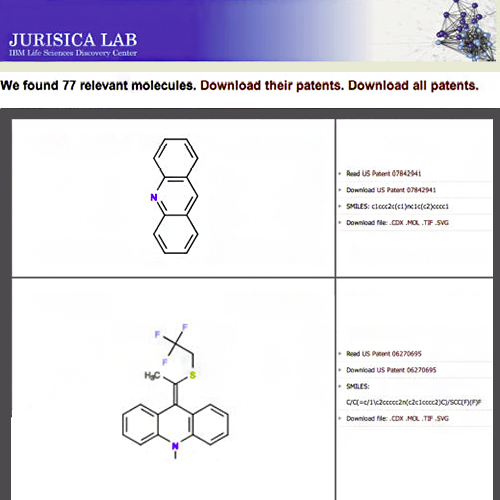
SCRIPDB - A Portal for Easy Access to Syntheses,Chemicals, and Reactions In Patents
SCRIPDB provides the full original patent text, reactions, and relationships described within any individual patent, in addition to the molecular files common to structural databases. We discuss how such information is valuable in medical text mining, chemical image analysis, reaction extraction, and in silico pharmaceutical lead optimization. SCRIPDB may be searched by exact chemical structure, substructure, or molecular similarity and the results may be restricted to patents describing synthetic routes.
Heifets A, Jurisica I. SCRIPDB: a portal for easy access to syntheses, chemicals and reactions in patents. Nucleic Acids Res. 40:D428-33, 2012
Heifets A, Jurisica I. SCRIPDB: a portal for easy access to syntheses, chemicals and reactions in patents. Nucleic Acids Res. 40:D428-33, 2012
miRAnno - an integrative tool for pathway annotation of miRNAs
miRAnno uses comprehensive molecular interaction network and random walks with restart to measure the association between miRNAs and individual pathways. Independent validation shows that miRAnno achieves higher signal-to-noise ratio compared to the standard enrichment analysis.
Tomas Tokar, Chiara Pastrello, Mark Abovsky, Sara Rahmati, Igor Jurisica, miRAnno—network-based functional microRNA annotation, Bioinformatics, 38(2):592–593, 2022.
Go to miRAnno home page
Tomas Tokar, Chiara Pastrello, Mark Abovsky, Sara Rahmati, Igor Jurisica, miRAnno—network-based functional microRNA annotation, Bioinformatics, 38(2):592–593, 2022.
Go to miRAnno home page
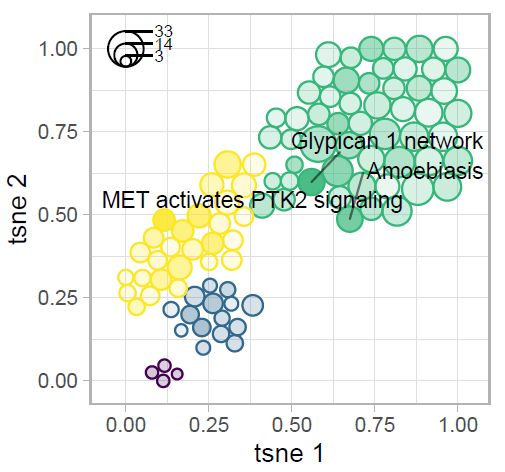
GSOAP: A novel tool for visualisation of gene set over-representation analysis
Gene set over-representation analysis (GSOA) is a method of enrichment analysis that measures the fraction of genes of interest (e.g differentially expressed genes) belonging to a tested group of genes (e.g. pathway, protein family, Gene Ontology instance, etc.). GSOAP (Gene Set Over-representation Analysis Plots) is a tool for exploration and visualization of GSOA results. GSOAP provides simple yet efficient tool for exploration and visualisation of the results obtained by GSOA. Applying binary distance measures and dimensionality reduction techniques, GSOAP depicts relationships between the pathways (or other instances) obtained from GSOA, given the set of query genes; and allows to highlight important instance attributes, such as significance, closeness (centrality), clustering, or outliers. It can be used to visualise the results obtained from most common GSOA tools, including pathDIP, clusterProfiler, topGO, etc.
Tokar, T., Pastrello, C., Jurisica, I. GSOAP: A tool for visualization of gene set over-representation analysis, Bioinformatics, 36(9):2923-2925, 2020.
Go to GSOAP home page
Tokar, T., Pastrello, C., Jurisica, I. GSOAP: A tool for visualization of gene set over-representation analysis, Bioinformatics, 36(9):2923-2925, 2020.
Go to GSOAP home page
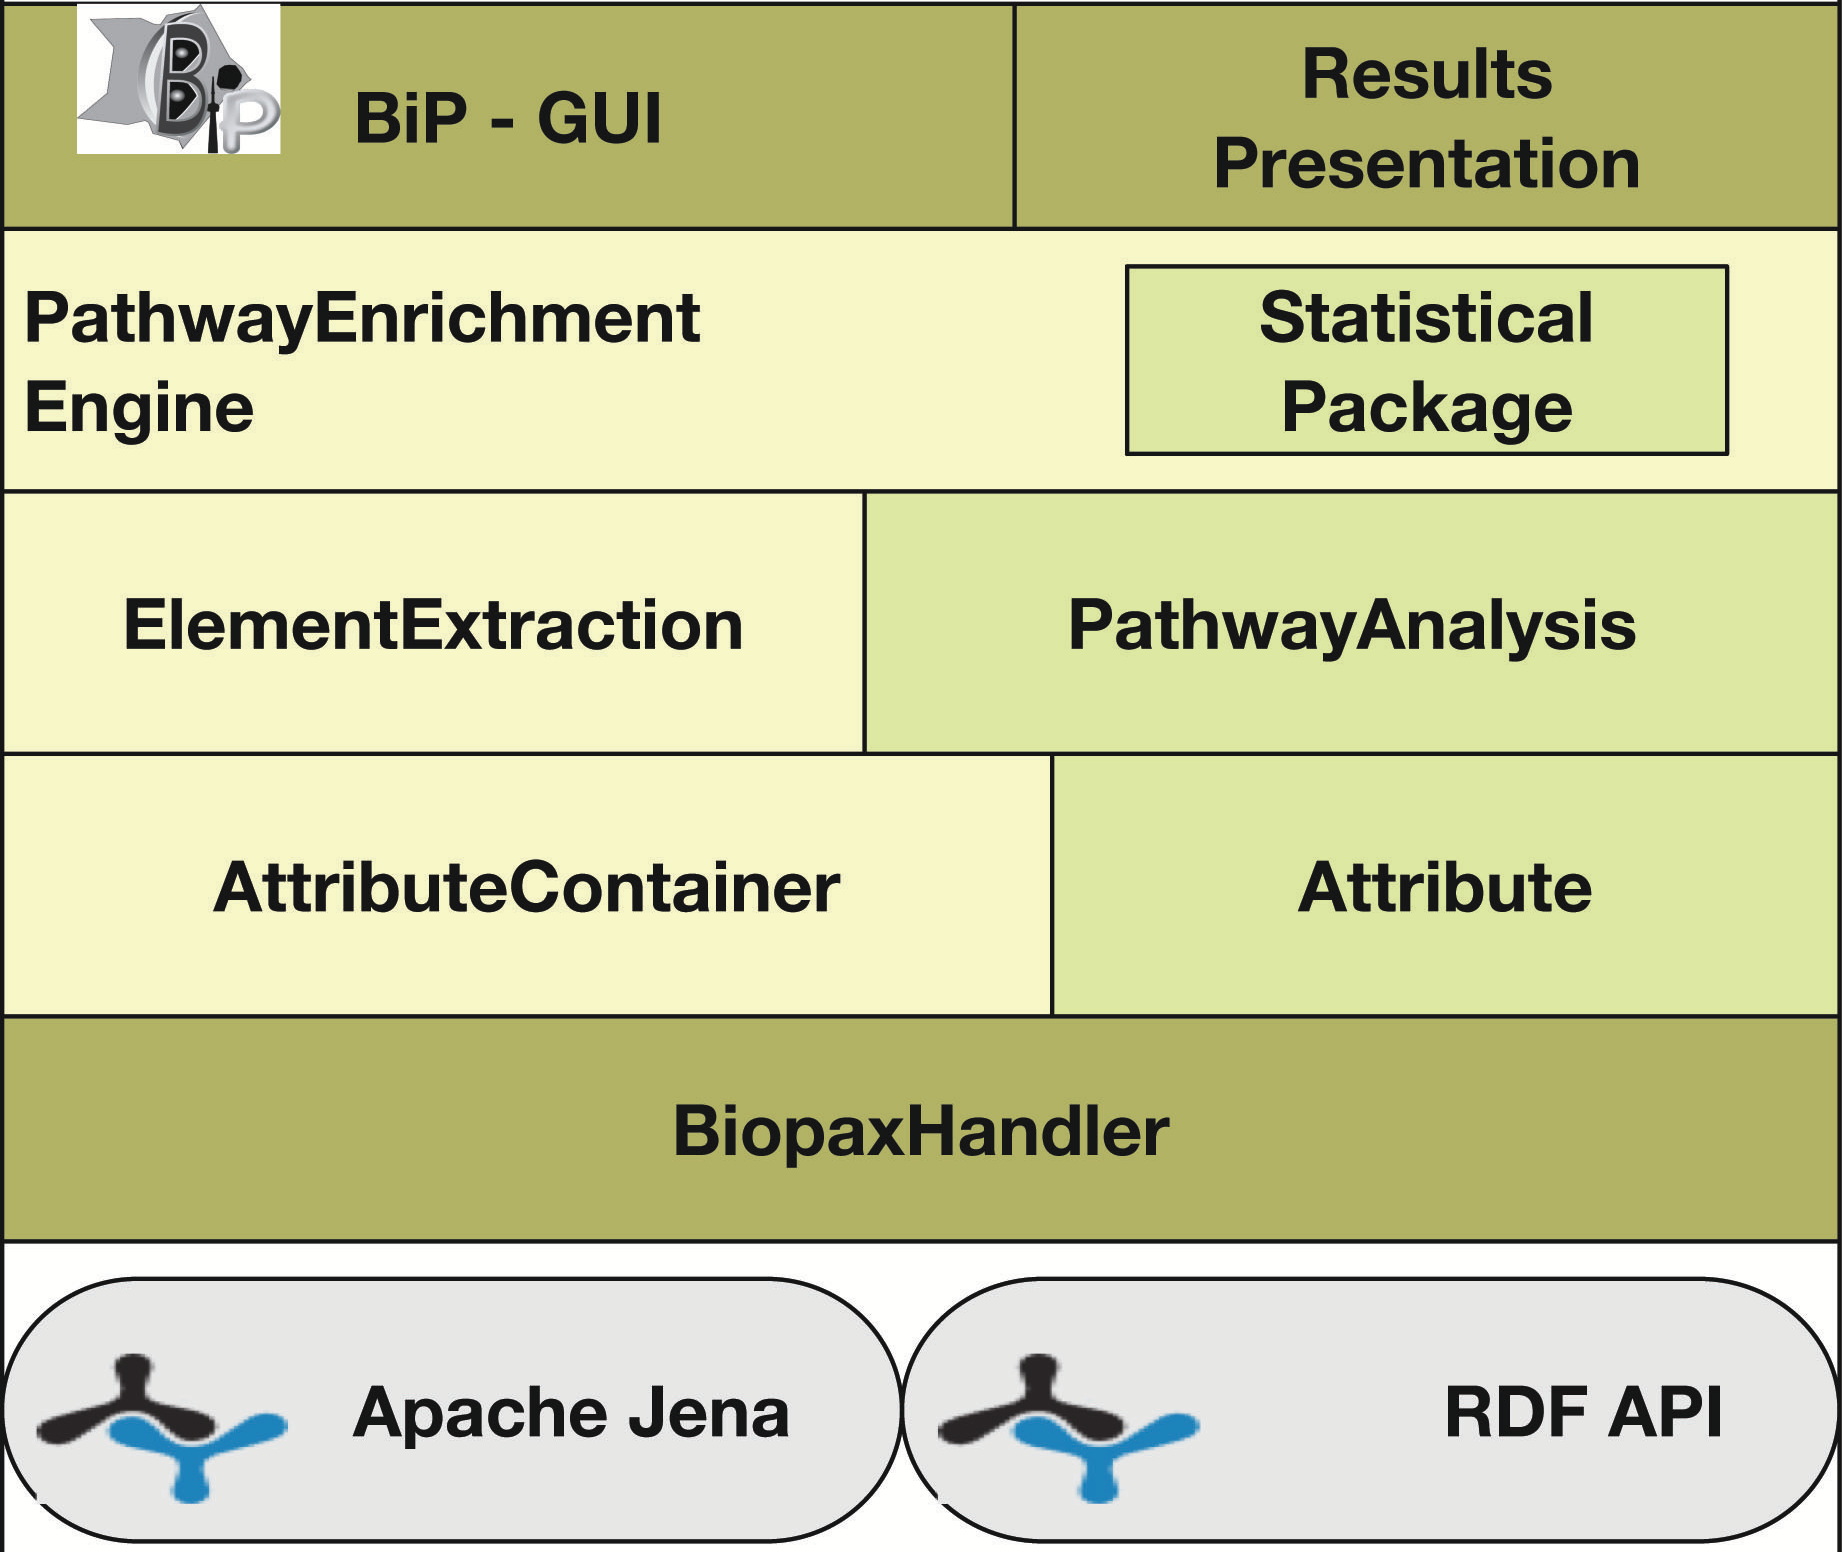
BIP - Parsing and enrichment analysis of BioPAX pathways
BIP is an automatic and graphical software tool aimed at performing the parsing and accessing of BioPAX pathway data, along with pathway enrichment analysis by using information coming from pathways encoded in BioPAX.
Agapito G, Pastrello C, Guzzi PH, Jurisica I, Cannataro M. BioPAX-Parser: parsing and enrichment analysis of BioPAX pathways, Bioinformatics, 36(15):4377-4378, 2020.
Go to BIP home page
Agapito G, Pastrello C, Guzzi PH, Jurisica I, Cannataro M. BioPAX-Parser: parsing and enrichment analysis of BioPAX pathways, Bioinformatics, 36(15):4377-4378, 2020.
Go to BIP home page
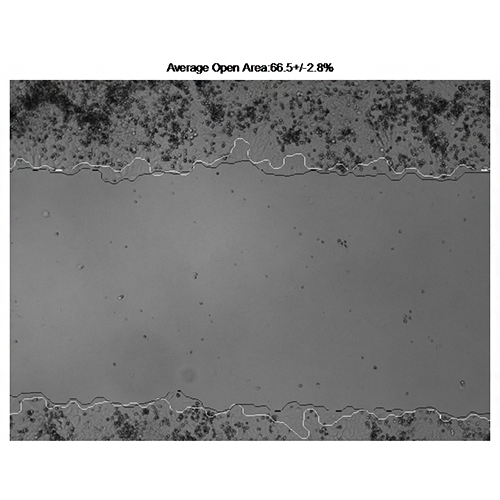
RQSA - Robust Quantitative Scratch Assay Analysis Tool
RQSA algorithm was created to help analyze results from the wound healing assay (or scratch assay) - a technique used to quantify the dependence of cell motility-a central process in tissue repair and evolution of disease-subject to various treatments conditions. RQSA implements statistical methods where migration rates are estimated, cellular behaviour is distinguished and outliers are identified among groups of unique experimental conditions. It decreased measurement errors and increased accuracy in the wound boundary at comparable processing times compared to previously developed methods.
Vargas A, Angeli M, Pastrello C, McQuaid R, Li H, Jurisicova A, Jurisica I. Robust quantitative scratch assay. Bioinformatics. 32(9):1439-40, 2016
Go to RQSA home page
Vargas A, Angeli M, Pastrello C, McQuaid R, Li H, Jurisicova A, Jurisica I. Robust quantitative scratch assay. Bioinformatics. 32(9):1439-40, 2016
Go to RQSA home page
RNSC - Restricted Neighborhood Search Clustering Algorithm
RNSC efficiently partitions networks into clusters using a cost function with the goal to identify and predict protein complexes.
King AD, Przulj N, Jurisica I. Protein complex prediction via cost-based clustering. Bioinformatics. 20(17):3013-20, 2004.
Go to RNSC home page
King AD, Przulj N, Jurisica I. Protein complex prediction via cost-based clustering. Bioinformatics. 20(17):3013-20, 2004.
Go to RNSC home page
USNAP: Fast unique dense region detection and its application to lung cancer.
We designed a scalable algorithm, USNAP, to effectively identify dense subgraphs that are unique to a time stamp given a dynamic graph. Importantly, USNAP provides a lower bound of the density measure in each step of the greedy algorithm. While USNAP is domain independent, we applied it to four non-small cell lung cancer (NSCLC) gene expression datasets. Stages in NSCLC were modeled as dynamic graphs, and input to USNAP. Importantly, USNAP is scalable, and has a time complexity of O(m + mclognc + nclognc), where m is the number of edges, and n is the number of vertices in the dynamic graph; mc is the number of edges, and nc is the number of vertices in the collapsed graph.
Wong SWH, Pastrello C, Kotlyar M, Faloutsos C, Jurisica I. USNAP: Fast unique dense region detection and its application to lung cancer, Bioinformatics, 39(8):btad477, 2023
Wong SWH, Pastrello C, Kotlyar M, Faloutsos C, Jurisica I. USNAP: Fast unique dense region detection and its application to lung cancer, Bioinformatics, 39(8):btad477, 2023
SDREGION: fast spotting of changing communities in biological networks
We designed a novel algorithm, SDREGION, that identifies subgraphs that decrease in density monotonically over time, referred to as d-regions or increase in density monotonically over time, referred to as i-regions. We introduced the objective function, Î"density, for identifying d-(i-)regions. SDREGION is a generic algorithm, and we evaluated it by modeling of the progression of lung cancer. In particular, we observed that SDREGION identified d-(i-)regions that capture mechanisms supported by literature. Importantly, andditional findings may provide novel mechanisms in tumor progression that will guide future biological experiments. SDREGION is scalable with a time complexity of O(mlogn + nlogn) where m is the number of edges, and n is the number of vertices in a given dynamic graph.
Wong, S., Pastrello, C., Kotlyar, M., Faloutsos, C., Jurisica, I. SDREGION: Fast spotting of changing communies in biological networks. Proceedings of the ACM SIGKDD International Conference on Knowledge Discovery and Data Mining, pp. 867-875, 2018.
Wong, S., Pastrello, C., Kotlyar, M., Faloutsos, C., Jurisica, I. SDREGION: Fast spotting of changing communies in biological networks. Proceedings of the ACM SIGKDD International Conference on Knowledge Discovery and Data Mining, pp. 867-875, 2018.
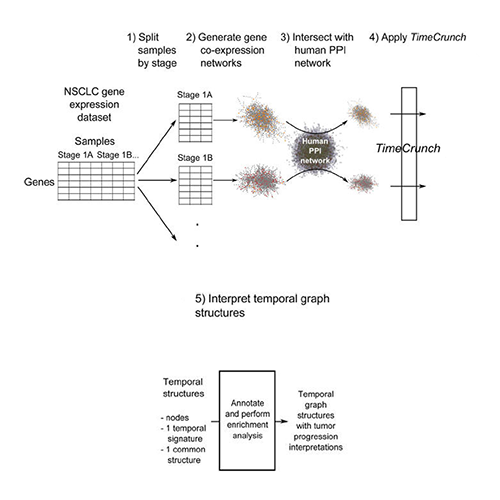
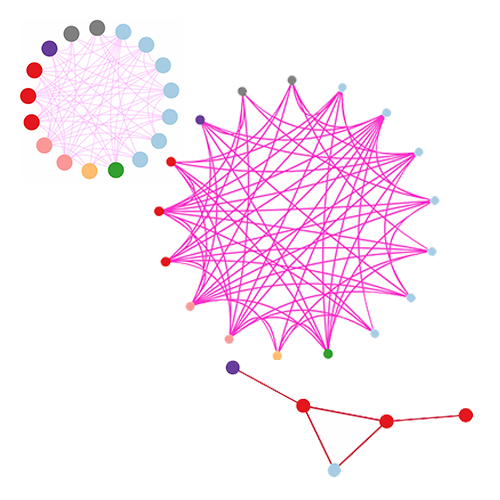
Temp-O: Modeling tumor progression via the comparison of stage-specific graphs
We proposed the Temporal-Omics -Temp-O- workflow to model tumor progression in non-small cell lung cancer (NSCLC) using graph comparisons between multiple stage-specific graphs. We showed that temporal structures are meaningful in the tumor progression of NSCLC. While the Temp-O workflow is generic, we applied it to NSCLC expression data from tumor samples across disease stages to model lung cancer progression, creating stage-specific tumor graphs. Validating our findings in independent datasets showed that differences in temporal network structures capture diverse mechanisms in NSCLC. Furthermore, results showed that structures are consistent and potentially biologically important as we observed that genes with similar protein names were captured in the same cliques for all cliques in all datasets. Importantly, the identified temporal structures are meaningful in the tumor progression of NSCLC as they agree with the molecular mechanism in the tumor progression or carcinogenesis of NSCLC. In particular, the identified major histocompatibility complex of class II temporal structures capture mechanisms concerning carcinogenesis; the proteasome temporal structures capture mechanisms that are in early or late stages of lung cancer; the ribosomal cliques capture the role of ribosome biosynthesis in cancer development and sustainment. Further, on a large independent dataset we validated that temporal network structures identified proteins that are prognostic for overall survival in NSCLC adenocarcinoma.
Wong SWH, Pastrello C, Kotlyar M, Faloutsos C, Jurisica I. Modeling tumor progression via the comparison of stage-specific graphs. Methods. 2018 Jan 1;132:34-41. doi: 10.1016/j.ymeth.2017.06.033. Epub 2017 Jul 3. PubMed PMID: 28684340.
Wong SWH, Pastrello C, Kotlyar M, Faloutsos C, Jurisica I. Modeling tumor progression via the comparison of stage-specific graphs. Methods. 2018 Jan 1;132:34-41. doi: 10.1016/j.ymeth.2017.06.033. Epub 2017 Jul 3. PubMed PMID: 28684340.
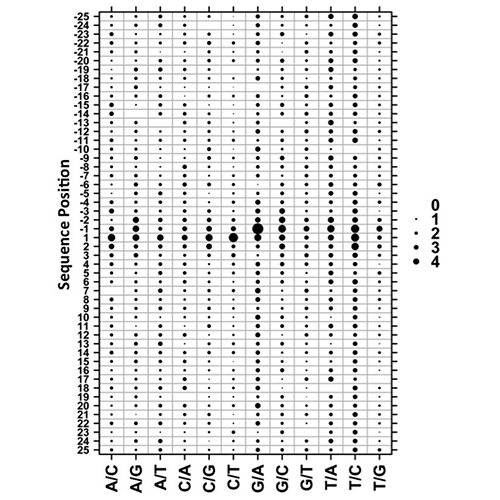
T-WPPDC: A Tree-based Approach to Motif Discovery and Sequence Classification
Tree-based Weighted-Position Pattern Discovery and Classification algorithm (T-WPPDC) supports both unsupervised pattern discovery and supervised sequence classification. It is a minimally parameterized algorithm for both pattern discovery and sequence classification that directly incorporates positional information. It identifies positionally enriched patterns using the Kullbackâ€" Leibler distance between foreground and background sequences at each position. This spatial information is used to discover positionally important patterns. T-WPPDC then uses a scoring function to discriminate different biological classes. We validated T-WPPDC by prediction of single nucleotide polymorphisms (SNPs) from flanking sequence. We evaluated 672 separate experiments on 120 datasets derived from multiple species. T-WPPDC outperformed other pattern discovery methods and was comparable to the supervised machine learning algorithms. The algorithm is computationally efficient and largely insensitive to dataset size. It allows arbitrary parameterization and is embarrassingly parallelizable.
Yan, R., Boutros, P.C., Jurisica, I. A tree-based approach for motif discovery and sequence classification. Bioinformatics. 27(15):2054-61, 2011.
Yan, R., Boutros, P.C., Jurisica, I. A tree-based approach for motif discovery and sequence classification. Bioinformatics. 27(15):2054-61, 2011.
GAP Portal: Integrative approach to predicting gene functional associations using using novel semantic similarity measure
GAP (Gene functional Association Predictor) is an integrative method for predicting and characterizing gene functional associations. It integrates different biological features using a novel taxonomy-based semantic similarity measure in predicting and prioritizing high-quality putative gene associations. The proposed similarity measure increases information gain from the available gene annotations. The annotation information is incorporated from several public pathway databases, Gene Ontology annotations as well as drug and disease associations from the scientific literature.
Vafaee F, Rosu D, Broackes-Carter F, Jurisica I. Novel semantic similarity measure improves an integrative approach to predicting gene functional associations. BMC Syst Biol. 7:22, 2013.
Go to GAP home page
Vafaee F, Rosu D, Broackes-Carter F, Jurisica I. Novel semantic similarity measure improves an integrative approach to predicting gene functional associations. BMC Syst Biol. 7:22, 2013.
Go to GAP home page
BTSVQ-Binary tree structured vector quantization
BTSVQ is a computational tool to analyze and visualize microarray gene expression data. This technique merges the results of SOM (genes space), and partitive k-means (specimen space). The algorithm uses vector quantization and self-organizing capabilities of SOMs in finding significant gene centers in gene space (high dimensionality and large number of clusters), and the effectiveness of k-means in experiment space (medium dimensionality and low number of clusters).
Sultan M, Wigle DA, Cumbaa CA, Maziarz M, Glasgow J, Tsao MS, Jurisica I. Binary tree-structured vector quantization approach to clustering and visualizing microarray data. Bioinformatics. 18 Suppl 1:S111-9, 2002.
Go to BTSVQ home page
Sultan M, Wigle DA, Cumbaa CA, Maziarz M, Glasgow J, Tsao MS, Jurisica I. Binary tree-structured vector quantization approach to clustering and visualizing microarray data. Bioinformatics. 18 Suppl 1:S111-9, 2002.
Go to BTSVQ home page
All contents copyright Jurisica Lab, Krembil Research Institute, UHN. Last modified March 2024