
Researchers have investigated how virtual machines should execute high-level language programs for many years. The research has been focused on a few main areas. First, innovative virtual machine support can play a role in the deployment of qualitatively new and different computer languages. Second, virtual machines provide an infrastructure by which ordinary computer languages can be more easily deployed on many different hardware platforms. Third, researchers continually devise new ways to enable language VMs to run virtual programs faster.
This chapter will describe research which touches on all these issues. We will briefly discuss interpretation in preparation for a more in-depth treatment in cha:Background-dispatch-techniques. We will describe how modern object-oriented languages depend on the virtual machine to efficiently invoke methods by following the evolution of this support from the early efforts to modern speculative inlining techniques. Finally, we will briefly describe trace-based binary optimization to set the scene for cha:Design-and-Implementation-YETI.
A static compiler is probably the best solution when performance is paramount, portability is not a great concern, destinations of calls are known at compile time and programs bind to external symbols before running. Thus, most third generation languages like C and FORTRAN are implemented this way. However, if the language is object-oriented, binds to external references late, and must run on many platforms, it may be advantageous to implement a compiler that targets a fictitious high-level language virtual machine (HLL VM) instead.
In Smith's taxonomy, an HLL VM is a system that provides a process with an execution environment that does not correspond to any particular hardware platform [#!smith-arch-vm!#]. The interface offered to the high-level language application process is usually designed to hide differences between the platforms to which the VM will eventually be ported. For instance, UCSD Pascal p-code [#!ucsd-pascal-book!#] and Java bytecode [#!java:jvm:spec!#] both express virtual instructions as stack operations that take no register arguments. Gosling, one of the designers of the Java virtual machine, has said that he based the design of the JVM on the p-code machine [#!gosling-interview!#]. Smalltalk [#!Smalltalk80Implementation!#], Self [#!ungar-object-perf!#] and many other systems have taken a similar approach. A VM may also provide virtual instructions that support peculiar or challenging features of the language. For instance, a Java virtual machine has specialized virtual instructions (eg. invokevirtual) in support of virtual method invocation. This allows the compiler to generate a single, relatively high-level virtual instruction instead of a sequence of complex machine and ABI dependent instructions.
This approach has benefits for the users as well. For instance, applications can be distributed in a platform neutral format. In the case of the Java class libraries or UCSD Pascal programs, the amount of virtual software far exceeds the size of the VM. The advantage is that the relatively small amount of effort required to port the VM to a new platform enables a large body of virtual applications to run on the new platform also.
There are various approaches a HLL VM can take to actually execute a virtual program. An interpreter fetches, decodes, then emulates each virtual instruction in turn. Hence, interpreters are slow but can be very portable. Faster, but less portable, a dynamic compiler can translate to native code and dispatch regions of the virtual application. A dynamic compiler can exploit runtime knowledge of program values so it can sometimes do a better job of optimizing the program than a static compiler [#!stoodley:developerworks2007!#].
Figure:
Example Java Virtual Program showing
source (on the left) and Java virtual instructions, or bytecodes,
on the right.
![\includegraphics[width=1\textwidth,keepaspectratio]{figs/javaRunningExample}% WIDTH=553 HEIGHT=175](img8.png)
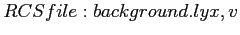
A virtual program, as shown in Figure ![]() ,
is a sequence of virtual instructions and related meta-data. The
figure introduces an example program we will use as a running example,
so we will briefly describe it here. First, a compiler, javac
in the example, creates a class file describing the virtual
program in a standardized format. (We show only one method, but any
real Java example would define a whole class.) Our example consists
of just one Java expression {c=a+b+1} which adds the values
of two Java local variables and a constant and stores the result in
a third. The compiler has translated this to the sequence of virtual
instructions shown on the right. The actual semantics of the virtual
instructions are not important to our example other than to note that
none are virtual branch instructions.
,
is a sequence of virtual instructions and related meta-data. The
figure introduces an example program we will use as a running example,
so we will briefly describe it here. First, a compiler, javac
in the example, creates a class file describing the virtual
program in a standardized format. (We show only one method, but any
real Java example would define a whole class.) Our example consists
of just one Java expression {c=a+b+1} which adds the values
of two Java local variables and a constant and stores the result in
a third. The compiler has translated this to the sequence of virtual
instructions shown on the right. The actual semantics of the virtual
instructions are not important to our example other than to note that
none are virtual branch instructions.
The distinction between a virtual instruction and an instance of a virtual instruction is conceptually simple but sometimes hard to clearly distinguish in prose. We will always refer to a specific use of a virtual instruction as an ``instance''. For example, the first instruction in our example program is an instance of iload. On the other hand, we might also use the term virtual instruction to refer to a kind of operation, for example that the iload virtual instruction takes one parameter.
Java virtual instructions may take implicit arguments that are passed
on a expression stack. For instance, in Figure ![]() ,
the iadd instruction pops the top two slots of the expression
stack and pushes their sum. This style of instruction set is very
compact because there is no need to explicitly list parameters of
most virtual instructions. Consequently many virtual instructions,
like iadd, consist of only the opcode. Since there are fewer
than 256 Java virtual instructions, the opcode fits in a byte, and
so Java virtual instructions are often referred to as bytecode.
,
the iadd instruction pops the top two slots of the expression
stack and pushes their sum. This style of instruction set is very
compact because there is no need to explicitly list parameters of
most virtual instructions. Consequently many virtual instructions,
like iadd, consist of only the opcode. Since there are fewer
than 256 Java virtual instructions, the opcode fits in a byte, and
so Java virtual instructions are often referred to as bytecode.
In addition to arguments passed implicitly on the stack, certain virtual instructions take immediate operands. In our example, the iconst virtual instruction takes an immediate operand of 1. Immediate operands are also required by virtual branch instructions (the offset of the destination) and by various instructions used to access data.
The bytecode in the figure depends on a stack frame organization that
distinguishes between local variables and the expression stack. Local
variable array slots, or lva slots, are used to store local
variables and parameters. The simple function shown in the figure
needs only four local variable slots. The first slot, lva[0], stores
a hidden parameter, the object handle![]() to the invoked-upon object and is not used in this example. Subsequent
slots, lva[1], lva[2] and lva[3] store a, b
and c respectively. The expression stack is used to store
temporaries for most calculations and parameter passing. In general
``load'' form bytecodes push values in lva slots onto the expression
stack. Bytecodes with ``store'' in their mnemonic typically pop
the value on top of the expression stack and store it in a named lva
slot.
to the invoked-upon object and is not used in this example. Subsequent
slots, lva[1], lva[2] and lva[3] store a, b
and c respectively. The expression stack is used to store
temporaries for most calculations and parameter passing. In general
``load'' form bytecodes push values in lva slots onto the expression
stack. Bytecodes with ``store'' in their mnemonic typically pop
the value on top of the expression stack and store it in a named lva
slot.
An interpreter is the simplest way for an HLL VM to execute a guest virtual program. Whereas the persistent format of a virtual program conforms to some external specification, when it is read by an interpreter the structure of its loaded representation is chosen by the designers of the interpreter. For instance, designers may prefer a representation that word-aligns all immediate parameters regardless of their size. This would be less compact, but more portable and potentially faster to access, than the original byte code on most architectures.
An abstraction implemented by most interpreters is the notion of a virtual program counter, or vPC. It points into the loaded representation of the program and serves two main purposes. First, the vPC is used by dispatch code to indicate where in the virtual program execution has reached and hence which virtual instruction to emulate next. Second, the vPC is conventionally referred to by virtual instruction bodies to access immediate operands.
We do not expect interpretation to be efficient compared to executing compiled native code. Consider Java's iadd virtual instruction. On a typical processor an integer add can be performed in one instruction. To emulate a virtual addition instruction requires three or more additional instructions to load the inputs from and store the result to the expression stack.
However, it is not just the path length of emulation that causes performance problems. Also important is the latency of the branch instructions used to transfer control to the virtual instruction body. To optimize dispatch. researchers have proposed various dispatch techniques to efficiently branch from body to body. Recently, Ertl and Gregg showed that on modern processors branch mispredictions caused by dispatch branches are a serious drain on performance [#!ertl:dispatch-arch!#,#!ertl:vm-branch-pldi!#].
When emulated by most current high-level language virtual machines, the branching patterns of the virtual program are hidden from the branch prediction resources of the underlying real processor. This is despite the fact that a typical virtual machine defines roughly the same sorts of branch instructions as does a real processor and that a running virtual program exhibits similar patterns of virtual branch behaviour as does a native program running on a real CPU. In sec:Context-Problem we discuss in detail how our approach to dispatch deals with this issue, which we have dubbed the context problem.
A faster way of executing a guest virtual program is to compile its virtual instructions to native code before it is executed. This approach long predates Java, perhaps first appearing for APL on the HP3000 [#!JohnstonAPLJIT1979!#] as early as 1979. Deutsch and Schiffman built a just in time (JIT) compiler for Smalltalk in the early 1980's that ran about twice as fast as interpretation [#!deutEffImplSmall84!#].
Early systems were highly memory constrained by modern standards.
It was of great concern, therefore, when translated native code was
found to be about four times larger than the originating bytecode![]() . Lacking virtual memory, Deutsch and Schiffman took the view that
dynamic translation of bytecode was a space time trade-off. If space
was tight then native code (space) could be released at the expense
of re-translation (time). Nevertheless, their approach was to execute
only native code. Each method had to be fetched from a native code
cache or else re-translated before execution. Today a similar attitude
prevails except that it has also been recognized that some code is
so infrequently executed that it need not be translated in the first
place. The bytecode of methods that are not hot can simply be interpreted.
. Lacking virtual memory, Deutsch and Schiffman took the view that
dynamic translation of bytecode was a space time trade-off. If space
was tight then native code (space) could be released at the expense
of re-translation (time). Nevertheless, their approach was to execute
only native code. Each method had to be fetched from a native code
cache or else re-translated before execution. Today a similar attitude
prevails except that it has also been recognized that some code is
so infrequently executed that it need not be translated in the first
place. The bytecode of methods that are not hot can simply be interpreted.
A JIT can improve the performance of a JVM substantially. Relatively
early Java JIT compilers from Sun Microsystems, as reported by the
development team in 1997, improved the performance of the Java raytrace
application by a factor of 2.2 and compress by 6.8 [#!sunJITieeeMicro97!#]![]() . More recent JIT compilers have increased the performance further [#!HOTSPOT141!#,#!jalapenoIBMJournal2000!#,#!tokyoJIT_IBMJR!#].
For instance, on a modern personal computer Sun's Hotspot server dynamic
compiler currently runs the entire SPECjvm98 suite more than 4 times
faster than the fastest interpreter. Some experts suggest that in
the not too distant future, systems based on dynamic compilers will
run faster than the code generated by static compilers [#!stoodley:developerworks2007!#,#!stoodley:cgo-keynote!#].
. More recent JIT compilers have increased the performance further [#!HOTSPOT141!#,#!jalapenoIBMJournal2000!#,#!tokyoJIT_IBMJR!#].
For instance, on a modern personal computer Sun's Hotspot server dynamic
compiler currently runs the entire SPECjvm98 suite more than 4 times
faster than the fastest interpreter. Some experts suggest that in
the not too distant future, systems based on dynamic compilers will
run faster than the code generated by static compilers [#!stoodley:developerworks2007!#,#!stoodley:cgo-keynote!#].
Modern languages offer users powerful features that challenge VM implementors. In this section we will discuss the impact of object-oriented method invocation and late binding of external references. There are many other issues that affect Java performance which we discuss only briefly. The most important amongst them are memory management and thread synchronization.
Garbage collection refers to a set of techniques used to manage memory in Java (as in Smalltalk and Self) where unused memory (garbage) is detected automatically by the system. As a result, the programmer is relieved of any responsibility for freeing memory that he or she has allocated. Garbage collection techniques are somewhat independent of dynamic compilation techniques. The primary interaction requires that threads can be stopped in a well-defined state prior to garbage collection. So-called safe points must be defined at which a thread periodically saves its state to memory. Code generated by a JIT compiler must ensure that safe points occur frequently enough that garbage collection is not unduly delayed. Typically this means that each transit of a loop must contain at least one safe point.
Java provides explicit, built-in, support for threads. Thread synchronization refers mostly to the functionality that allows only one thread to enter certain regions of code at a time. Thread synchronization must be implemented at various points and the techniques for implementing it must be supported by code generated by the JIT compiler.
Over the last few decades, object-oriented development grew from a vision, to an industry trend, to a standard programming tool. Object-oriented techniques stressed development systems in many ways, but the one we need to examine in detail here is the challenge of polymorphic method invocation.
The destination of a callsite in an object-oriented language is not determined solely by the signature of a method, as in C or FORTRAN. Instead, it is determined at run time by a combination of the method signature and the class of the invoked-upon object. Callsites are said to be polymorphic as the invoked-upon object may turn out to be one of potentially many classes.
Most object-oriented languages categorize objects into a hierarchy of classes. Each object is an instance of a class which means that the methods and data fields defined by that class are available for the object. Each class, except the root class, has a super-class or base-class from which it inherits fields and methods.
Each class may override a method and so at run time the system must dispatch the definition of the method corresponding to the class of the invoked-upon object. In many cases it is not possible to deduce the exact type of the object at compile time.
Figure:
Example of Java method containing a polymorphic
callsite
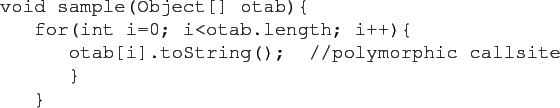
A simple example will make the above description concrete. When it is time to debug a program almost all programmers rely on facilities to view a textual description of their data. In an object-oriented environment this suggests that each object should define a method that returns a string description of itself. This need was recognized by the designers of Java and consequently they defined a method in the root class Object:
There are literally hundreds of definitions of toString in
a Java system and in many cases the compiler cannot discern which
one will be the destination of the callsite. Since it is not possible
to determine the destination of the callsite at compile time, it must
be done when the program executes. Determining the destination taxes
performance in two main ways. First, locating the method to dispatch
at run time requires computation. This will be discussed in Section
![]() . Second, the inability to predict
the destination of a callsite at compile time reduces the efficacy
of interprocedural optimizations and thus results in relatively slow
systems. This is discussed next.
. Second, the inability to predict
the destination of a callsite at compile time reduces the efficacy
of interprocedural optimizations and thus results in relatively slow
systems. This is discussed next.
Optimization can be stymied by polymorphic callsites. At compile time, an optimizer cannot determine the destination of a call, so obviously the target cannot be inlined. In fact, standard interprocedural optimization as carried out by an optimizing C or FORTRAN compiler is simply not possible [#!muchnick97!#].
In the absence of interprocedural information, an optimizer cannot guess what calculations are made by a polymorphic callee. Knowledge of the destination of the callsite would permit a more precise analysis of the values modified by the call. For instance, with runtime information, the optimizer may know that only one specific version of the method exists and that this definition simply returns a constant value. Code compiled speculatively under the assumption that the callsite remains monomorphic could constant propagate the return value forward and hence be much better than code compiled under the conservative assumption that other definitions of the method may be called.
Given the tendency of modern object-oriented software to be factored into many small methods which are called throughout a program, even in its innermost loops, these optimization barriers can significantly degrade the performance of the generated code. A typical example might be that common subexpression elimination cannot combine identical memory accesses separated by a polymorphic callsite because it cannot prove that all possible callees do not kill the memory location. To achieve performance comparable to procedural compiled languages, interprocedural optimization techniques must somehow be applied to regions laced with polymorphic callsites.
sec:Dynamic-Object-oriented-optimization describes various solutions to these issues.
A basic design issue for any language is when external references are resolved. Java binds references very late in order to support flexible packaging in general and downloadable code in particular. (This contrasts with traditional languages like C, which rely on a link-editor to bind to external symbols before they run.) The general idea is that a Java program may start running before all the classes that it needs are locally available. In Java, binding is postponed until the last possible moment, when the virtual instruction making the reference executes for the first time. Then, during the first execution, the reference is either resolved or a software exception is raised. This means that the references a program attempts to resolve depends on the path of execution through the code.
This approach is convenient for users and challenging for language
implementors. Whenever Java code is executed for the first time the
system must be prepared to handle unresolved external references.
An obvious, but slow, approach is to simply check whether an external
reference is resolved each time the virtual instruction executes.
For good performance, only the first execution should be burdened
with any binding overhead. One way to achieve this is for the virtual
program to rewrite itself when an external reference is resolved.
For instance, suppose a virtual instruction, vop, takes an
immediate parameter that names an unresolved class or method. When
the virtual instruction is first executed the external name is resolved
and an internal VM data structure describing it is created. The loaded
representation of the virtual instruction is then rewritten, say to
vop_resolved, which takes the address of the data structure
as an immediate parameter. The implementation of vop_resolved
can safely assume that the external reference has been resolved successfully.
Subsequently vop_resolved will execute in place of vop
with no binding overhead![]() .
.
The process of virtual instruction rewriting is relatively simple to carry out when instructions are being interpreted. For instance, it is possible to fall back on standard thread support libraries to protect overwriting from multiple threads racing to rewrite the instruction. It is more challenging if the resolution is being carried out by dynamically compiled native code [#!vj_cgo!#].
Early efforts to build dynamic optimizers were embedded in applications or C or FORTRAN run time systems.
Early experiments with dynamic optimization indicated that large performance improvements are possible. Typical early systems were application-specific. Rather than compile a language, they dynamically generated machine code to calculate the solution to a problem described by application specific data. Later, researchers built semi-automatic dynamic systems that would re-optimize regions of C programs at run time [#!leeLeone96optimizingML!#,#!auslander96fast!#,#!MLGilmore97!#,#!grant99dyc!#,#!grant00dyc!#].
Although the semi-automatic systems did not enable dramatic performance improvements across the board, this may be a consequence of the performance baseline to which they compared themselves. The prevalent programming languages of the time were supported by static compilation and so it was natural to use the performance of highly optimized binaries as the baseline. The situation for modern languages like Java is somewhat different. Dynamic techniques that do not pay off relative to statically optimized C code may be beneficial when applied to code naïvely generated by a JIT. Consequently, a short description of a few early systems seems worthwhile.
In 1968 Ken Thompson built a dynamic compiler which accepted a textual description of a regular expression and dynamically translated it into machine code for an IBM 7094 computer [#!thompson68-regexp!#]. The resulting code was dispatched to find matches quickly.
In 1985 Pike et al. invented an often-cited technique to generate good code for quickly copying, or bitblt'ing, regions of pixels from memory onto a display [#!pike85hardwaresoftware!#]. They observed that there was a bewildering number of special cases (caused by various alignments of pixels in display memory) to consider when writing a good general purpose bitblt routine. Instead they wrote a dynamic code generator that could produce a good (near optimal) set of machine instructions for each special case. At worst, their system executed only about 400 instructions to generate code for a bitblt.
In the mid-1990's Lee and Leone [#!leeLeone96optimizingML!#] built FABIUS, a dynamic optimization system for the research language ML [#!MLGilmore97!#]. FABIUS depends on a particular use of curried functions. Curried functions take one or more functions as parameters and return a new function that is a composition of the parameters. FABIUS interprets the call of a function returned by a curried function as a clue from the programmer that dynamic re-optimization should be carried out. Their results, which they describe as preliminary, indicate that small, special purpose, applications such as sparse matrix multiply or a network packet filter may benefit from their technique but the time and memory costs of re-optimization are difficult to recoup in general purpose code.
More recently it has been suggested that C and FORTRAN programs can benefit from dynamic optimization. Auslander et al. [#!auslander96fast!#], Grant et al. [#!grant99dyc!#,#!grant00dyc!#] and others have built semi-automatic systems to investigate this. Initially these systems required the user to identify regions of the program that should be dynamically re-optimized as well as the variables that are runtime constant. Later systems allowed the user to identify only the program variables that are runtime constants and could automatically identify which regions should be re-optimized at run time.
In either case, the general idea is that the user indicates regions of the program that may be beneficial to dynamically compile at run time. The dynamic region is precompiled into template code. Then, at run time, the values of runtime constants can be substituted into the template and the dynamic region re-optimized. Auslander's system worked only on relatively small kernels like matrix multiply and quicksort. A good way to look at the results was in terms of break even point. In this view, the kernels reported by Auslander had to execute from about one thousand to a few tens of thousand of times before the improvement in execution time obtained by the dynamic optimization outweighed the time spent re-compiling and re-optimizing.
Subsequent work by Grant et al. created the DyC system [#!grant99dyc!#,#!grant00dyc!#]. DyC simplified the process of identifying regions and applied more elaborate optimizations at run time. This system can handle real programs, although even the streamlined process of manually designating only runtime constants is reported to be time consuming. Their methodology allowed them to evaluate the impact of different optimizations independently, including complete loop unrolling, dynamic zero and copy propagation, dynamic reduction of strength and dynamic dead assignment elimination to name a few. Their results showed that only loop unrolling had sufficient impact to speed up real programs and in fact without loop unrolling there would have been no overall speedup at all.
Some of the challenges to performance discussed above are caused by new, more dynamic language features. Consequently, optimizations that have traditionally been carried out at compile time are no longer effective and must be redeployed as dynamic optimizations carried out at run time. The best example, polymorphic method invocation, will be discussed next.
Locating the definition of a method for a given object at run time is a search problem. To search for a method definition corresponding to a given object the system must search the classes in the hierarchy. The search starts at the class of the object, proceeds to its super class, to the super class of its super class, and so on, until the root of the class hierarchy is reached. If each method invocation requires the search to be repeated, the process will be a significant tax on overall performance. Nevertheless, this is exactly what occurs in a naïve implementation of Smalltalk, Self, Java, JavaScript or Python.
If the language permits early binding, the search may be converted to a table lookup at compile-time. For instance, in C++, all the possible destinations of a callsite are known when the program is loaded. As a result, a C++ virtual callsite can be implemented as an indirect branch via a virtual table specific to the class of the object invoked on. This reduces the cost to little more than a function pointer call in C. The construction and performance of virtual function tables has been heavily studied, for instance by Driesen [#!polymorphic-opus!#].
Real programs tend to have low effective polymorphism. This means that the average callsite has very few actual destinations. If fact, most callsites are effectively monomorphic, meaning they always call the same method. Note that low effective polymorphism does not imply that a smart compiler should have been able to deduce the destination of the call. Rather, it is a statistical observation that real programs typically make less use of polymorphism than they might.
For late-binding languages it is seldom possible to generate efficient code for a callsite at compile time. In response, various researchers have investigated how it might be done at run time. In general, it pays to cache the destination of a callsite when the callsite is commonly executed and its effective polymorphism is low. The in-line cache, invented by Deutsch and Schiffman [#!deutEffImplSmall84!#] for Smalltalk more than 20 years ago, replaces the polymorphic callsite with the native instruction to call the cached method. The prologue of all methods is extended with fix-up code in case the cached destination is not correct. Deutsch and Shiffman reported hitting the in-line cache about 95% of the time for a set of Smalltalk programs.
Hölzle [#!Hozle-diss!#] extended the in-line cache to be a polymorphic in-line cache (PIC) by generating code that successively compares the class of the invoked object to a few possible destination types. The implementation is more difficult than an in-line cache because the dynamically generated native code sequence must sequentially compare and conditionally branch against several possible destinations. A PIC extends the performance benefits of an in-line cache to effectively polymorphic callsites. For example, on a SPARCstation-2 Hölzle's lookup would cost only 8 + 2n cycles, where n is the actual polymorphism of the callsite. A PIC lookup costs little more than an in-line cache for effectively monomorphic callsites and is much faster for callsites that are effectively polymorphic.
Smalltalk adopted the position that essentially every software entity should be represented as an object. A fascinating discussion of the qualitative benefits anticipated from this approach appears in Goldberg's book [#!Smalltalk80Environment!#].
The designers of Self took an even more extreme position. They held
that even control flow should be expressed using object-oriented concepts![]() . They understood that this approach would require them to invent
new ways to efficiently optimize message invocation if the performance
of their system was to be reasonable. Their research program was extremely
ambitious and they explicitly compared the performance of their system
to optimized C code executing the same algorithms.
. They understood that this approach would require them to invent
new ways to efficiently optimize message invocation if the performance
of their system was to be reasonable. Their research program was extremely
ambitious and they explicitly compared the performance of their system
to optimized C code executing the same algorithms.
In addition, the Self system aimed to support the most interactive programming environment possible. Self supports debugging, editing and recompiling methods while a program is running with no need to restart. This requires very late binding. The combination of the radically pure object-oriented approach and the ambitious goals regarding development environment made Self a sort of trial-by-fire for object-oriented dynamic compilation techniques.
Ungar, Chambers and Hölzle have published several papers [#!chambers-diss!#,#!hlzle92debugging!#,#!Hozle-diss!#,#!thirdGenSelf94!#] that describe how the performance of Self was increased from more than an order of magnitude slower than compiled C to only twice as slow. A readable summary of the techniques is given by Ungar et al. [#!ungar-object-perf!#]. A thumbnail summary would be that effective monomorphism can be exploited by a combination of type-checking guard code (to ensure that some object's type really is known) and static inlining (to expose the guarded code to interprocedural optimization). To give the flavor of this work we will briefly describe two specific optimizations: customization and splitting.
Customization is a relatively old object-oriented optimization introduced by Craig Chambers in his dissertation [#!chambers-diss!#] in 1988. The general idea is that a polymorphic callsite can be turned into a static callsite (or inlined code) when the type of object on which the method is invoked is known. The approach taken by a customizing compiler is to replicate methods with type specialized copies so as to produce callsites where types are known.
Ungar et al. give a simple, convincing example in [#!ungar-object-perf!#].
In Self, it is usual to write generic code, for instance algorithms
that can be shared by integer and floating point code. An example
is a method to calculate minimum. The min method is defined
by a class called Magnitude. All concrete number classes,
like Integer and Float, thus inherit the min
method. A customizing compiler will arrange that customized definitions
of min are compiled for Integer and Float.
Inlining the customized methods replaces the polymorphic call![]() to < within the original min method by the appropriate
arithmetic compare instructions
to < within the original min method by the appropriate
arithmetic compare instructions![]() in each of the customized versions of integer and float min.
in each of the customized versions of integer and float min.
Oftentimes, customized code can be inlined only when protected by a type guard. The guard code is essentially an if-then-else construct where the ``if'' tests the type of an object, the ``then'' inlines the customized code and the ``else'' performs the original polymorphic method invocation of the method. Chambers [#!chambers-diss!#] noted that the predicate implemented by the guard establishes the type of the invoked object for one leg of the if-then-else, but following the merge point, this knowledge is lost. Hence, he suggested that following code be ``split'' into paths for which knowledge of types is retained. This suggests that instead of allowing control flow to merge after the guard, a splitting compiler can replicate following code to preserve type knowledge.
Incautious splitting could potentially cause exponential code size expansion. This implies that the technique is one that should only be applied to relatively small regions where it is known that polymorphic dispatch is hurting performance.
The first Java JIT compilers translated methods into native instructions and improved polymorphic method dispatch by deploying techniques such as method customization and splitting invented decades previously for Smalltalk. New innovations in garbage collection and thread synchronization, not discussed in this review, were also made. Despite all this effort, Java implementations were still slow. More aggressive optimizations had to be developed to accommodate the performance challenges posed by Java's object-oriented features, particularly the polymorphic dispatch of small methods. The writers of Sun's Hotspot compiler white paper note:
Observations similar to the above led Java researchers to perform speculative optimizations to transform the program in ways that are correct at some point, but may be invalidated by legal computations made by the program. For instance, Pechtchanski and Sarkar speculatively generate code for a method with only one loaded definition that assumes it will never be overridden. Later, if the loader loads a class that provides another definition of the method, the speculative code may be incorrect and must not run again. In this case, the entire enclosing method (or inlined method nest) must be recompiled under more realistic assumptions and the original compilation discarded [#!pechtchanski03!#].
In principle, a similar approach can be taken if the speculative code is correct but turns out to be slower than it could be.
The infrastructure to replace a method is complex, but is a fundamental requirement of speculative optimization in a method-oriented dynamic compiler. It consists of roughly two parts. First, meta data must be produced when a method is optimized that allows local variables in the stack frame and registers of a running method to be migrated to a recompiled version. This is somewhat similar to the problem of debugging optimized code [#!hlzle92debugging!#]. Later, at run time, the meta data is used to convert the stack frame of the invalid code to that of the recompiled code. Fink and Qian describe a technique called on stack replacement (OSR) that shows how to restrict optimization so that recompilation is always possible [#!fink2003!#]. The key idea is that values that may be dead under traditional optimization schemes must be kept alive so that a less aggressively optimized replacement method can continue.
The dynamic compilers described thus far compile entire methods or inlined method nests. The problem with this approach is that even a hot method may contain cold code. The cold code may never be executed or perhaps will later become hot only after being compiled.
Compiling cold code that never executes can have only indirect effects such as allowing the optimizer to prove facts about the portions of the method that are hot. This can have a positive impact on performance, by enabling the optimizer to prove facts about hot regions that enable faster code to be produced. Also, it can have a negative impact, as the cold code may force the optimizer to generate more conservative, slower, code for the hot regions. Thus, various researchers have investigated how compiling code code can be avoided.
Whaley described a prototype that compiled partial methods, skipping cold code. He modified the compiler to generate glue code stubs in the place of cold code. The glue code had two purposes. First, to the optimizer at compile time, the glue code included annotations so that it appeared to use the same variables as the cold code. Consequently the optimizer has a true model of variables used in the cold regions and so generated correct code for the hot ones. Second, when run, the glue code interacted with the runtime system to exit the code cache and resume interpretation. Hence, if a cold region was entered, control would simply revert to the interpreter. His results showed a large compile time savings, leading to modest speed ups for certain benchmarks [#!Whaley01!#].
Suganuma et al. investigated this issue further by modifying a method-based JIT to speculatively optimize hot inlined method nests. Their technique inlines only hot regions, replacing cold code with guard code [#!suganuma:region-based!#]. The technique is speculative because conservative assumptions in the cold code are ignored. When execution triggers guard code, it exposes the speculation as wrong and hence is a signal that continued execution of the inlined method nest may be incorrect. On stack replacement and recompilation are used to recover. They also measured a significant reduction in compile time. However, only a modest speedup was obtained, suggesting either that conservative assumptions stemming from the cold code are not a serious concern or their recovery mechanism is too costly.
HP Dynamo [#!Dynamo00!#,#!dynamoAsplosLessIsMore2000!#,#!dynamoTR!#] is a same-ISA binary optimizer. Dynamo initially interprets a binary executable program, detecting hot interprocedural paths, or traces, through the program as it runs. These traces are then optimized and loaded into a trace cache. Subsequently, when the interpreter encounters a program location for which a trace exists, it is dispatched from the trace cache. If execution diverges from the path taken when the trace was generated then a trace exit occurs, execution leaves the trace cache and interpretation resumes. If the program follows the same path repeatedly, it will be faster to execute code generated for the trace rather than the original code. Dynamo successfully reduced the execution time of many important benchmarks. Several binary optimization systems, including DynamoRIO [#!brueningInfraDynamic2003!#], Mojo [#!mojo2000!#], Transmeta's CMS [#!code_morphing!#], and others, have since used traces.
Dynamo uses a simple heuristic, called Next Executing Tail (NET), to identify traces. NET starts generating a trace from the destination of a hot reverse branch, since this location is likely to be the head of a loop, and hence a hot region of the program is likely to follow. If a given trace exit becomes hot, a new trace is generated starting from its destination.
Software trace caches are efficient structures for dynamic optimization.
Bruening and Duesterwald [#!UnitShapes00!#] compare execution time
coverage and code size for three dynamic optimization units: method
bodies, loop bodies, and traces. They show that method bodies require
significantly more code size to capture an equivalent amount of execution
time than either traces or loop bodies. This result, together with
the properties outlined in Section ![]() , suggest
that traces may be a good choice for a unit of compilation.
, suggest
that traces may be a good choice for a unit of compilation.
Bruening describes a new version of Dynamo which runs on the Intel x86 architecture. The current focus of this work is to provide an efficient environment to instrument real world programs for various purposes such as to improve the security of legacy applications [#!brueningInfraDynamic2003!#,#!brueningDuesterwaldWin2000!#].
One interesting application of DynamoRIO was by Sullivan et
al. [#!baron:dynamo-interp!#]. They ran their own tiny interpreter
on top of DynamoRIO in the hope that it would be able to dynamically
optimize away a significant proportion of interpretation overhead.
They did not initially see the results they were hoping for because
the indirect dispatch branches confounded Dynamo's trace selection.
They responded by creating a small interface by which the interpreter
could programatically give DynamoRIO hints about the relationship
between the virtual pc and the hardware pc. This was their way around
what we call the context problem in Section ![]() .
Whereas interpretation slowed down by almost a factor of two using
regular DynamoRIO, after they had inserted calls to the hint API,
they saw speedups of about 20% on a set of small benchmarks. Baron [#!baron:interp-dynamorio!#]
reports similar performance results running a similarly modified Kaffe
JVM [#!kaffe:vm!#].
.
Whereas interpretation slowed down by almost a factor of two using
regular DynamoRIO, after they had inserted calls to the hint API,
they saw speedups of about 20% on a set of small benchmarks. Baron [#!baron:interp-dynamorio!#]
reports similar performance results running a similarly modified Kaffe
JVM [#!kaffe:vm!#].
Hiniker, Hazelwood and Smith performed a simulation study evaluating enhancements to the basic Dynamo trace selection heuristics [#!hiniker-trace-select-improvements!#]. They observed two main problems with Dynamo's NET heuristic. The first problem, trace separation, occurs when traces that turn out to often execute sequentially happen to be placed far apart in the trace cache, hurting the locality of reference of code in the instruction cache. LEI maintains a branch history mechanism as part of its trace collection system that allows it to do a better job handling loop nests, requiring fewer traces to span the nest. The second problem, excessive code duplication, occurs when many different paths become hot through a region of code. The problem is caused when a trace exit becomes hot and a new trace is generated that diverges from the preexisting trace for only one or a few blocks before rejoining its path. As a consequence, the new trace replicates blocks of the old trace from the place they rejoin to their common end. Combining several such observed traces together forms a region with multiple paths and less duplication. A simulation study suggests that using their heuristics, fewer, smaller selected traces will account for the same proportion of execution time.
Gal, Probst and Franz describe the Hotpath project [#!gal:hotpath!#]. Hotpath extends JamVM (one of the interpreters we use for our experiments) to be a trace oriented mixed-mode system. They focus on traces starting at loop headers and do not compile traces other than those in loops. Thus, they do not attempt trace linking as described by Dynamo, but rather ``merge'' traces that originate from side exits leading back to loop headers. This technique allows Hotpath to compile loop nests. They describe an interesting way of modeling traces using single static assignment (SSA) [#!Cytron:ssa!#] that exploits the constrained flow of control present in traces. This both simplifies their construction of SSA and allows very efficient optimization. Their experimental results show excellent speedup, within a factor of two of Sun's HotSpot, for scientific style loop nests like those in the LU, SOR and Linpack benchmarks, and more modest speedup, around a factor of two over interpretation, for FFT. No results are given for tests in the SPECjvm98 suite, perhaps because their system does not yet support ``trace merging across (inlined) method invocations'' [#!gal:hotpath!#, page 151]. The optimization techniques they describe seem complimentary to the overall architecture we propose in cha:Design-and-Implementation-YETI.
Branch prediction is an important consideration in the design of a
high level language VM because commonly used dispatch techniques represent
an unusual workload for modern processors. As we shall see in Chapter ![]() ,
techniques that were efficient on older machines may be very slow
on modern processors for which accurate branch prediction is essential
for good performance. The basic problem is that many interpretation
techniques evolved when the path length of dispatch code was
the most important design consideration whereas on modern computers
the predictability of dispatch branches is key.
,
techniques that were efficient on older machines may be very slow
on modern processors for which accurate branch prediction is essential
for good performance. The basic problem is that many interpretation
techniques evolved when the path length of dispatch code was
the most important design consideration whereas on modern computers
the predictability of dispatch branches is key.
Modern processors implement deep pipelines to achieve good performance. The main idea is to split the processing of instructions up into pipeline stages and overlap the processing of the stages to achieve high throughput. Straight-line sequences of instructions can easily be read ahead, decoded and executed. However, branches pose a challenge because their destination may not be known until well after they have been decoded. If the processor simply waited until the destination of the branch is known performance would be poor because the pipeline would run dry. Thus, modern architectures attempt to predict the destination of branches and speculatively decode and execute the instructions there. There is a rich body of research on branch prediction, since branches are otherwise very costly on pipelined architectures. In this thesis we care only about techniques adopted by real microprocessors[#!mcfarling-predictors-wrl!#]. With a prediction in hand, the processor will proceed as if the destination of the branch is known. If the prediction turns out to be correct the results calculated by the speculatively dispatched instructions can be committed to architectural state. If the branch prediction turns out to be wrong, then the speculative work must be thrown away.
There are three kinds of branch instructions that interest us:
Direct branch instructions encode the destination explicitly as an operand, typically as an signed offset to be added to the program counter. Unconditional direct branches thus pose little challenge, as the destination can be calculated as soon as the instruction has been decoded. Conditional branch instructions are harder - in order to predict the destination the processor must guess whether (or not) the branch will be taken. Fortunately, techniques have been developed that allow conditional branches to be predicted accurately. Most techniques involve memories that record the previous behavior of each branch and guess whether a branch is taken or not based on the recorded information in combination with various aspects of the execution context of the processor.
Indirect branches take operands that identify a location in memory. The destination of the branch is the contents of the memory location. Indirect branches can be challenging to predict because they are data dependent on memory. However, it turns out that for many workloads the destination of a given indirect branch is always or mostly the same. In this case the processor simply remembers the destination last taken by an indirect branch and predicts that subsequent executions will branch to the same place.
As pointed out by Ertl and Gregg most high level language virtual machines do not behave this way because the indirect branches used to dispatch virtual instructions have many different destinations [#!ertl:vm-branch-pldi!#].
Direct calls are similar to direct branches in that the destination is explicit. Thus, the destination of a call is easy to predict. A return instruction, on the other hand, has the flavor of an indirect branch, in that on many architectures it is defined to pop its destination off a stack in memory. However, in most cases, calls and returns are perfectly matched and so the destination of each return is the instruction following the corresponding call. To handle this case processors maintain a stack of addresses. Whenever a call is decoded its address is pushed on the stack. By popping the stack the destination of the corresponding return can be predicted perfectly.
The primary mechanism used to predict indirect branches on modern computers is the branch target buffer (BTB). The BTB is a hardware table in the CPU that associates the destination of a small set of branches with their address [#!hennpatt!#]. The idea is to simply remember the previous destination of each branch. This is the same as assuming that the destination of each indirect branch is correlated with the address in memory of the branch instruction itself.
The Pentium 4 implements a 4K entry BTB [#!hintonPentium4!#]. (Instead of a BTB the PowerPC 970 has a much smaller 32 entry count cache [#!ibm:ppc970!#].) Direct threading confounds the BTB because all instances of a given virtual instruction compete for the same BTB slot.
Another kind of dynamic branch predictor is used for conditional branch
instructions. Conditional branches are relative, or direct, branches
so there are only two possible destinations. The challenge lies in
predicting whether the branch will be taken or fall through. For this
purpose modern processors implement a branch history table.
The PowerPC 7410, as an example, deploys a 2048 entry 2 bit branch
history table [#!motorola:mpc7410!#]. Direct threading also confounds
the branch history table as all the instances of each conditional
branch virtual instruction compete for the same branch history table
entry. In this case, the hard to predict branch is not an explicit
dispatch branch but rather the result of an if statement
in a virtual branch instruction body. This will be discussed in more
detail in Section ![]() .
.
Return instructions can be predicted perfectly using a stack of addresses pushed by call instructions. The Pentium 4 has a 16 entry return address stack [#!hintonPentium4!#] whereas the PPC970 uses a similar structure called the link stack [#!ibm:ppc970!#].
In this chapter we briefly traced the development of high-level language virtual machines from interpreters to dynamic optimizing compilers. We saw that interpreter designs may perform poorly on modern, highly pipelined processors, because current dispatch mechanisms cause too many branch mispredictions. This will be discussed in more detail in sec:Context-Problem. Later, in cha:Efficient-Interpretation, we describe our solution to the problem.
Currently, JIT compilers compile entire methods or inlined method nests. Since hot methods may contain cold code, this forces the JIT compiler and runtime system to support late binding. Should the cold code later become hot, a method-based JIT must recompile the containing method or inlined method nest to optimize the newly hot code. These issues add complexity to a method oriented system that could be avoided if compiled code contained no cold code. The HP Dynamo binary optimizer project defines a suitable candidate for a dynamically identified unit of compilation, namely the hot interprocedural path, or trace. In cha:Design-and-Implementation-YETI, we describe how a virtual machine can compile traces to incrementally compile code as it becomes hot.
![\begin{singlespace}
In the Java language, most method invocations are \emph{virt...
... smaller
sections of code to work with.\cite[pp 17]{HOTSPOT141}\end{singlespace}% WIDTH=556 HEIGHT=202](img10.png)