Machine learning projects require collaborative effort among team members with specialized knowledge and skills covering three major areas of work: understanding the business, designing the analytics solution, and getting the datasets ready for training and deployment.
While each area has its own focus, team members need to understand each other's work so as to be able to communicate and coordinate effectively to achieve project goals. Thus the GR4ML framework is organized into three sub-models (also introduced in the introduction and toy example pages), the Business View, the Analytics Design View, and the Data Preparation View.
Organizing modeling concepts into these views serves as a means for dealing with the complexity of analytics solutions, enhancing collaboration and clarity, and for managing the diversity of skillsets and roles required in such projects. These views, while representing different aspects and serving different purposes, are linked to each other to bridge the gap between business goals, machine learning algorithms, and data stores.
The Business View aims to (1) facilitate the elicitation and clarification of ML requirements in business contexts, (2) support analysis of those requirements (e.g., prioritization), and (3) ensure the alignment of business and analytics strategies. The main modeling elements are
Actors, Strategic Goals, Indicators, Decision Goals, Question Goals, and Insights.
Strategic Goals symbolize business objectives and strategies. Indicators represent numeric metrics that measure performance with regard to some objectives. Decision Goals represent situations where an Actor needs to select one option among a set of possibilities. They symbolize the decisions that are (or will be) supported by the ML system.
While each area has its own focus, team members need to understand each other's work so as to be able to communicate and coordinate effectively to achieve project goals. Thus the GR4ML framework is organized into three sub-models (also introduced in the introduction and toy example pages), the Business View, the Analytics Design View, and the Data Preparation View.
Organizing modeling concepts into these views serves as a means for dealing with the complexity of analytics solutions, enhancing collaboration and clarity, and for managing the diversity of skillsets and roles required in such projects. These views, while representing different aspects and serving different purposes, are linked to each other to bridge the gap between business goals, machine learning algorithms, and data stores.
Business View
Strategic Goals symbolize business objectives and strategies. Indicators represent numeric metrics that measure performance with regard to some objectives. Decision Goals represent situations where an Actor needs to select one option among a set of possibilities. They symbolize the decisions that are (or will be) supported by the ML system.
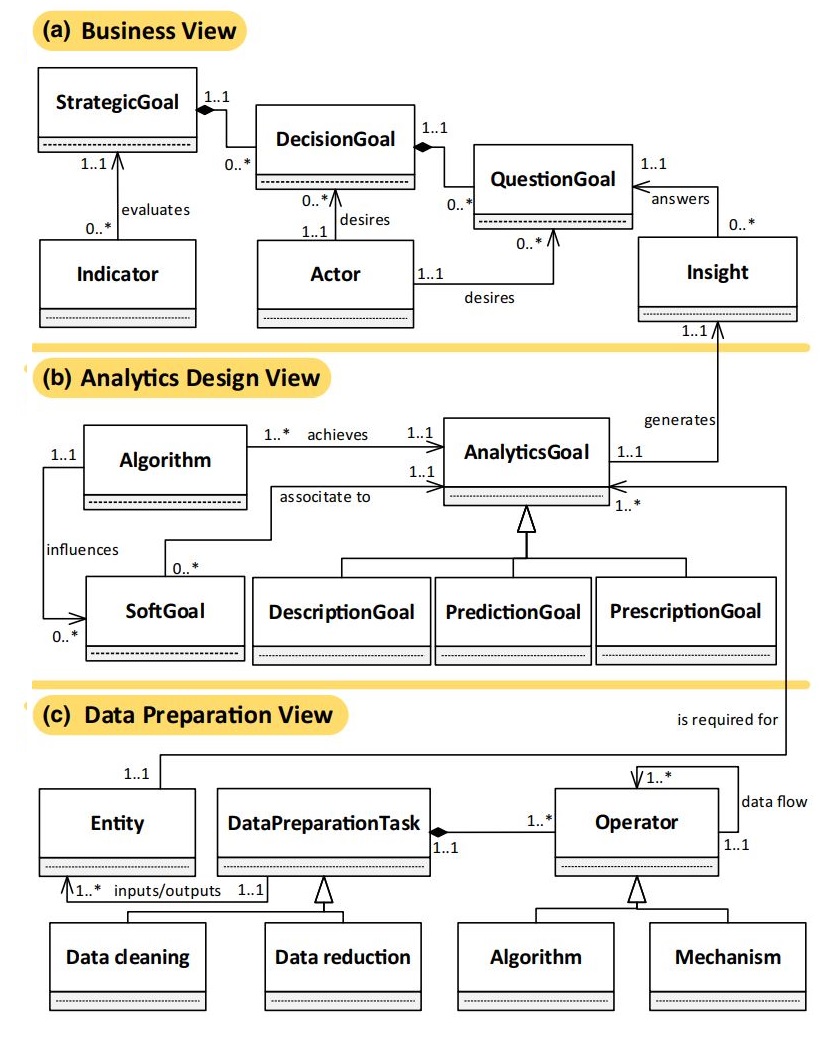
Question Goals represent the "needs-to-know" of the Actors during decision processes. For each Question Goal the Type, Topic, Tense, and Frequency attributes are specified. Question Type denotes the question phrase (what, who, when, where, why, how). Question topic captures the focus of analysis and reveals related parts of enterprise data stores for the problem at hand. Question Tense (past, present, future) represents the temporal aspect of the focus of the analysis. In many cases, specifying the tense facilitates finding a family of analytics techniques that is most relevant to the business needs. Question Frequency indicates how frequent the corresponding actors need an answer for the Question Goal. Insight elements characterize the kinds of patterns and findings that answer the Question Goals. For each insight element the Type, Input, Output, Usage Frequency, Update Frequency, and Learning Period attributes are defined. These attributes support translating the business questions into data mining problems.
The Analytics Design View aims to (1) support exploration of alternate approaches for the analytical problem at hand, (2) facilitate design of (machine learning) experiments and identifying trade-offs, and (3) support algorithm selection and monitoring their performance over time. The
main modeling elements are Analytics Goals, Algorithms, Softgoals, and Influences (see section (b) of the figure above).
Analytics Goals capture the intention of the analysis to be performed over the datasets. Three types of analytics goals are distinguished. If the analytics aims to predict the value of a data attribute (i.e., a variable or data column), it is called a Prediction Goal. If the analytics aims to summarize and explain the dataset, it is called a Description Goal. If the analytics aims to find the optimal alternative given a set of options and criteria, it is called a Prescription Goal. The type of Analytics Goal can be derived from the type of Insight that is required to generate (from the Business View). Each Analytics Goal is then connected to its corresponding Insight element via the generates link. Algorithms are procedures and calculation steps that are needed to fulfill an Analytics Goal. They are connected to Analytics Goals through the performs link, showing a means-end relationship. Softgoals represent quality requirements to be taken into account during design of the machine learning solution. Influence Links show how the Softgoals are satisfied through operationalization and design decisions. This view is connected to the previous modeling view through the generates links.
The Data Preparation View aims to (1) support the sharing and reuse of prepared data assets, (2) enhance data awareness among analytics users, and (3) ease data understanding by providing a reference for data engineers (who prepare datasets) on data preparation activities. The main modeling elements are Entities, Relationships Preparation Tasks, Operators, and Data Flows (see section (c) of the figure above).
Entities and their Relationships represent the raw data tables and their conceptual relationships. They also represent prepared datasets which are the eventual output of data preparation activities. The prepared datasets are connected to their corresponding Analytics Goals via the is required for link. Data Preparation Task represents the general task of preparing data for accomplishing some analytics goals. Data Cleaning, Data Reduction, Data Transformation, and Data Integration are types of preparation tasks. A Data Preparation Task consists of one or more Operators that are linked via Data Flows. This view is connected to the previous modeling view through the is required for links.
Analytics Design View
Analytics Goals capture the intention of the analysis to be performed over the datasets. Three types of analytics goals are distinguished. If the analytics aims to predict the value of a data attribute (i.e., a variable or data column), it is called a Prediction Goal. If the analytics aims to summarize and explain the dataset, it is called a Description Goal. If the analytics aims to find the optimal alternative given a set of options and criteria, it is called a Prescription Goal. The type of Analytics Goal can be derived from the type of Insight that is required to generate (from the Business View). Each Analytics Goal is then connected to its corresponding Insight element via the generates link. Algorithms are procedures and calculation steps that are needed to fulfill an Analytics Goal. They are connected to Analytics Goals through the performs link, showing a means-end relationship. Softgoals represent quality requirements to be taken into account during design of the machine learning solution. Influence Links show how the Softgoals are satisfied through operationalization and design decisions. This view is connected to the previous modeling view through the generates links.
Data Preparation View
Entities and their Relationships represent the raw data tables and their conceptual relationships. They also represent prepared datasets which are the eventual output of data preparation activities. The prepared datasets are connected to their corresponding Analytics Goals via the is required for link. Data Preparation Task represents the general task of preparing data for accomplishing some analytics goals. Data Cleaning, Data Reduction, Data Transformation, and Data Integration are types of preparation tasks. A Data Preparation Task consists of one or more Operators that are linked via Data Flows. This view is connected to the previous modeling view through the is required for links.