As an example of an expression, consider
 which we will call expression E.
This expression can be evaluated, step by step, as
which we will call expression E.
This expression can be evaluated, step by step, as  , then
 , then simply
  .
.
For part (2a) expression E should be drawn as a tree as shown in figure 2.
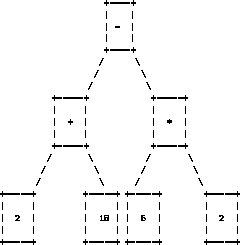
Figure 2: Expression E, drawn as a tree.
To draw the tree, you should use OOT drawing procedures (Do not draw the diagram using characters as was done in the simple illustrations shown here). You will want to use graphics subprograms such as Draw.Box, Draw.FillBox, maxx, maxy, Draw.Line, Draw.Cls, and locatexy. (See Section 8.2 and Appendix B.) Note that maxx and maxy give the size of your screen (or window) in pixels and allow you to fit your diagram to any size of screen (or window.) You can use locatexy and the put statement to put labels in your diagrams.
Note: When using graphics, you will probably
always want to end each put statement with dot-dot, as in
``put value ..''
The reason for this is that the 'put' statement without dot-dot blanks out
the right end of the current row of a diagram.