
CRVisToolkit: Visualizing Concentric Tube Continuum Robots
In our second release of the Continuum Robot Visualization Toolkit (CRVisToolkit), you will find a new set of MATLAB functions for visualization and plotting of concentric tube continuum robots (CTCR). With a framed curve represented by a series $n$ of 4x4 homogeneous transformation matrices (reshaped columnwise into a $n$x16 vector), indices of the tube end points, as well as the tube radii as input, you to create a MATLAB figure. In addition, we provide a utility function robotindependentmapping(kappa, phi, ell, ptsperseg) which generates a framed backbone curve using constant curvature arc parameters and the desired number of points (per segment) as input.
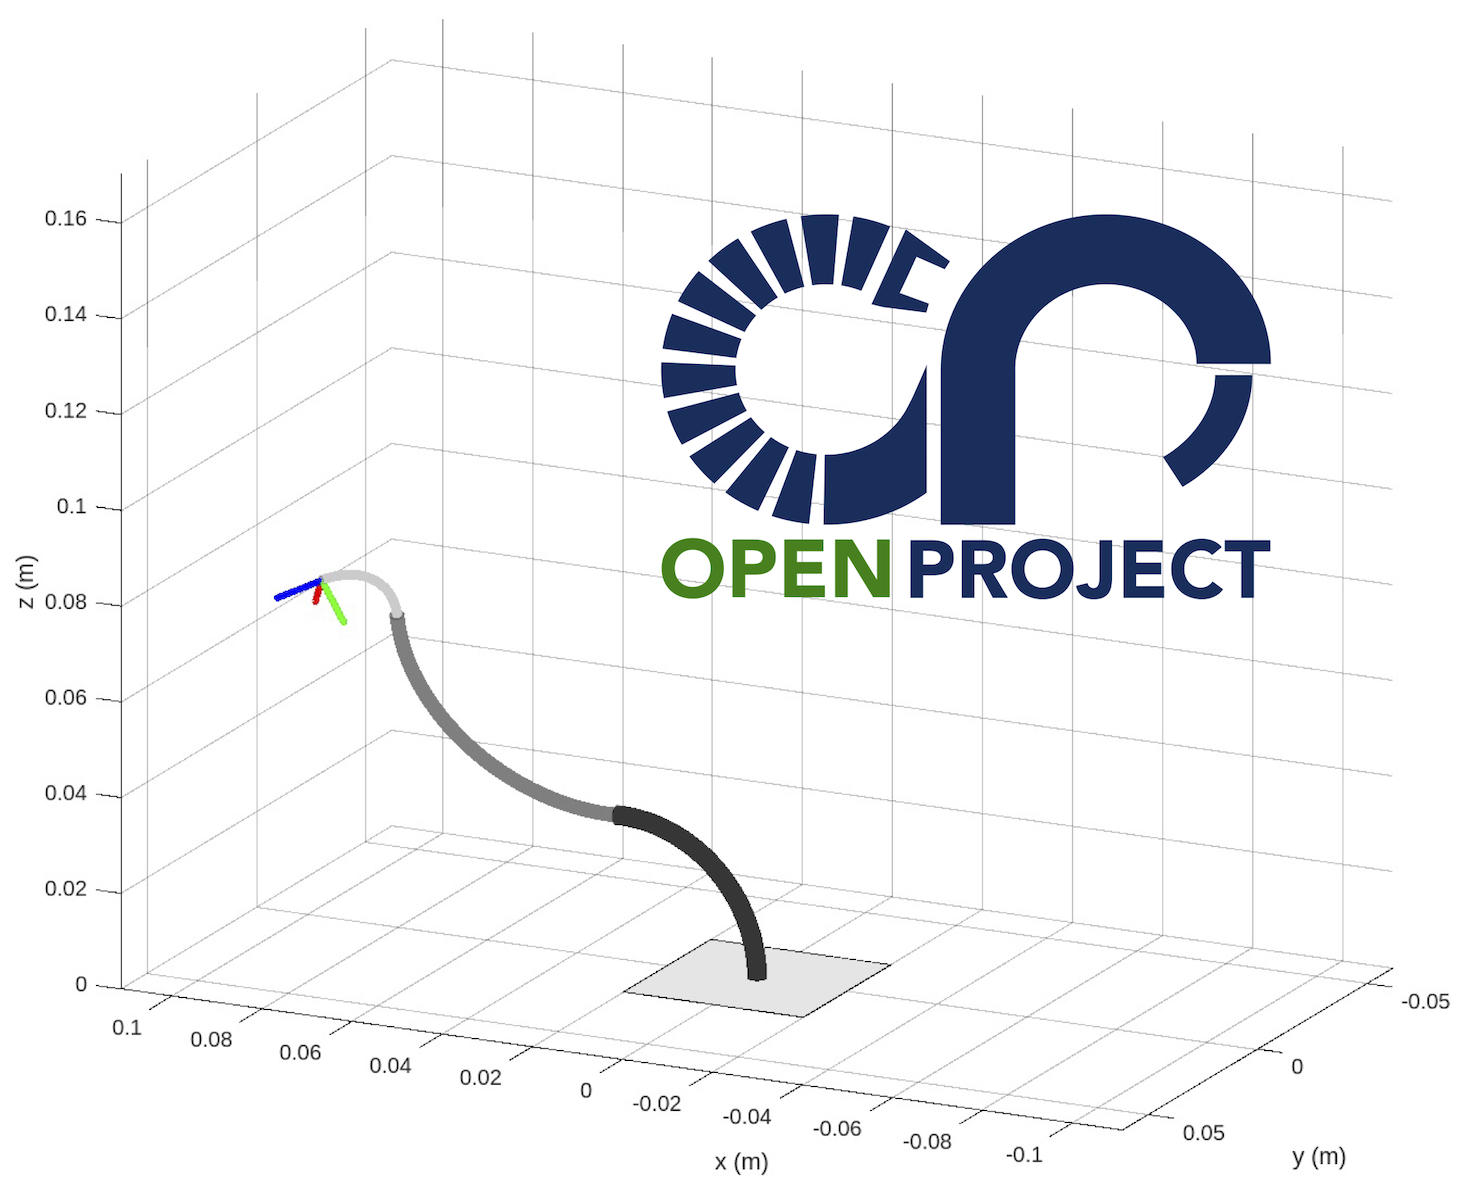
function [fig] = draw_ctcr(g,tube_end,r_tube,options)
% DRAW_CTCR Creates a figure of a concentric tube continuum robot (ctcr)
%
%   Takes a matrix with nx16 entries, where n is the number
%   of points on the backbone curve. For each point on the curve, the 4x4
%   transformation matrix is stored columnwise (16 entries). The x- and
%   y-axis span the material orientation and the z-axis is tangent to the
%   curve.
%
%   INPUT
%   g(n,16): backbone curve with n 4x4 transformation matrices reshaped into 1x16 vector (columnwise)
%   tube_end(1,m): indices of g where ctcr tubes terminate
%   r_tube(1,m): radii of tubes
%   options:
%       tipframe (shows tip frame, default true/1)
%       baseframe (shows robot base frame, default false/0)
%       projections (shows projections of backbone curve onto
%                    coordinate axes, default false/0)
%       baseplate (shows robot base plate, default false/0)
%
We provide an example file ctcr_draw_example.m to create a figure of a CTCR with three tubes. The example also makes use of the new utility function robotindependentmapping(kappa, phi, ell, ptsperseg). This function takes constant curvature parameters and generates a backbone curve. This backbone curve $g$ is in the format required by draw_ctcr(g,tube_end,r_tube,options) and draw_tdcr(g,seg_end,r_disk,r_height,options).
function g = robotindependentmapping(kappa, phi, ell, ptsperseg)
% ROBOTINDEPENDENTMAPPING creates a framed curve for given configuration parameters
%
%   EXAMPLE
%       g = robotindependentmapping([1/40e-3;1/10e-3],[0,pi],[25e-3,20e-3],10)
%       creates a 2-segment curve with radius of curvatures 1/40 and 1/10
%       and segment lengths 25 and 20, where the second segment is rotated by pi rad.
%
%   INPUT: configuration parameters
%       kappa (nx1): segment curvatures
%       phi (nx1): segment bending plane angles
%       l (nx1): segment lengths
%       ptsperseg (nx1): number of points per segment
%                        if n=1 all segments with equal number of points
%   OUTPUT: backbone curve
%       g (n,16): backbone curve with n 4x4 transformation matrices reshaped into 1x16 vector (columnwise)
%
Find out more and test CRVisToolkit on GitHub
Happy continuum robot visualization!
The CRVisToolkit stems from the Continuum Robotics Laboratory MATLAB codebase that grew over the past decade of our research activities. Numerous students contributed in one way or the other to the CTCR visualization and are acknowledged here in no particular order: Josephine Granna, Sven Lilge, and Malte Bormann.