
Visualizing Tendon-driven Continuum Robots in MATLAB
You have probably looked at continuum robotics papers and seen nice plots and visualizations. Or you have implemented your first continuum robot model which outputs a curve representing the backbone and are now wondering how to visualize your robot. Today, we provide you with utilities to create professional looking plots of tendon-driven continuum robots using MATLAB.
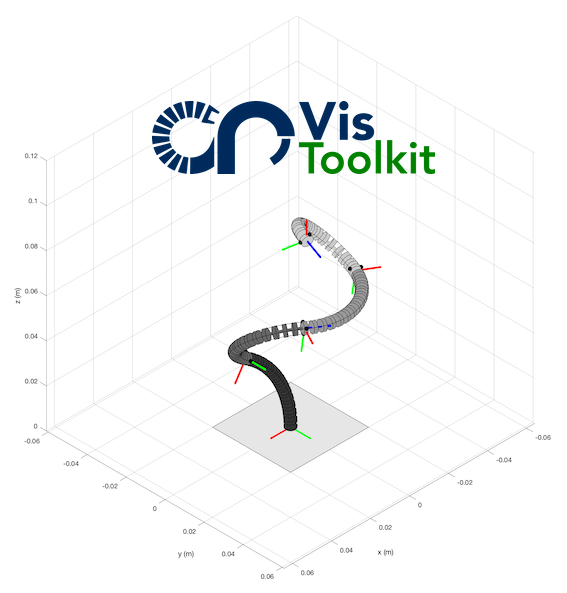
In our initial release of the Continuum Robot Visualization Toolkit (CRVisToolkit), you will find a set of MATLAB functions for visualization and plotting of continuum robots, in particular tendon driven continuum robots (TDCR). It takes a curve represented by a series $n$ of 4x4 homogeneous transformation matrices (reshaped columnwise into a $n$x16 vector), indices of the segment end points, as well as radius and disk height as input to create a MATLAB figure. We assume that the TDCR is operated by three tendons at $120$ degrees radial offset.
function fig = draw_tdcr(g,seg_end,r_disk,r_height,options)
%   Creates figure of a tendon-driven continuum robot (tdcr)
%
%   Takes a matrix with nx16 entries, where n is the number
%   of points on the backbone curve. For each point on the
%   curve, the 4x4 transformation matrix is stored columnwise
%   (16 entries). The x- and y-axis span the material
%   orientation and the z-axis is tangent to the curve.
%
%   INPUT
%   g(n,16): backbone curve with n 4x4 transformation
%            matrices reshaped into 1x16 vector (columnwise)
%   seg_end(1,m): indices of g where tdcr segments terminate
%   r_disk: radius of spacer disks
%   r_height: height of space disks
%   options:
%       tipframe (shows tip frame, default true/1)
%       segframe (shows segment end frames, default false/0)
%       baseframe (shows robot base frame, default false/0)
%       projections (shows projections of backbone curve onto
%                    coordinate axes, default false/0)
%       baseplate (shows robot base plate, default false/0)
To get you started, we provide three sample curves to generate three drawings.
load tdcr_curve_examples.mat

fig1 = draw_tdcr(onesegtdcr,10)
fig2 = draw_tdcr(threesegtdcr,[10 20 30],projections=1,baseplate=0);
fig3 = draw_tdcr(foursectdcr,[15 30 45 60],segframe=1,baseframe=1);
Find out more and test CRVisToolkit on GitHub
Stay tuned for updates on the CRVisToolkit. Coming soon: utility functions, such as the robot independent mapping for the constant curvature kinematics frameworks, and concentric tube continuum robot visualization functions!
The CRVisToolkit stems from the Continuum Robotics Laboratory MATLAB codebase that grew over the past decade of our research activities. Numerous students contributed in one way or the other and are acknowledged here in no particular order: Maria Neumann, Josephine Granna, Sven Lilge, Ernar Amanov, Priyanka Rao.