This course will examine the role of computers and software in understanding climate change. We will explore the use of computer models to build simulations of the global climate, including a historical view of the use of computer models to understand weather and climate, and a detailed look at the current state of computer modelling, especially how global climate models are tested, what kinds of experiments are performed with them, how scientists know they can trust the models, and how they deal with uncertainty. The course will also explore the role of computer models in helping to shape society’s responses to climate change, in particular, what they can (and can’t) tell us about how to make effective decisions about government policy, international treaties, community action and the choices we make as individuals.
The course will take a cross-disciplinary approach to these questions, looking at the role of computer models in the physical sciences, environmental science, politics, philosophy, sociology and economics of climate change. However, students are not expected to have any specialist knowledge in any of these fields prior to the course.
As a seminar course, we can be very flexible in what we cover. I've planned a set of core topics that focus on climate models and how they are used, but we can explore much more widely than this if we like.
| |
Seminar Topic |
Notes and Readings |
Week 1:
Tues
Sept 11
and
Thurs
Sept 13 |
Epistemology
 |
Notes:
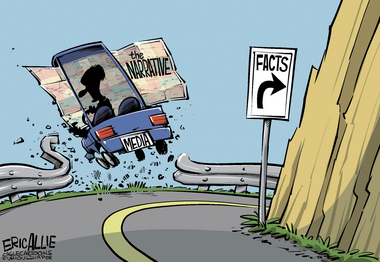
- We talked a lot about Epistemology. See this article by Cass R. Sunstein, which sums up some of the key themes, or the entry on epistemology in the Stanford Encyclopedia of Philosphy if you want to go deeper.
- We discussed where people get their information from, and how many of these sources are inter-linked. As an exercise, you might like to create your own Credibility Spectrum, sorting out which sources of information you find most credible and which the least.
- ...and we did some exercises where we jumped to incorrect conclusions because we were reacting to a pattern we'd identified rather than what was actually there. There's a long list of these Cognitive Biases on Wikipedia
- See also: A list of reasons why people don't believe in climate change
Homework (read these for Thursday's class):
- Social Epistemology and Climate Denialism a blog post I wrote in 2009 about a study at Yale that looks at why people believe what they believe about climate change and other issues.
- Science Literacy Means Understanding the Process, another blog post from 2009, about a conference session where the results of the "Six Americas" study was presented.
|
Week 2:
Tues
Sept 18 |
The Earth's Energy Balance
 |
Notes:
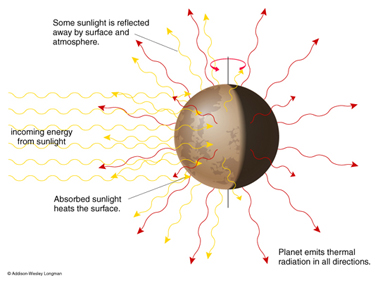
- We talked about the basic energy balance of the earth. There's a brief description of the basic zero-dimensional model on wikipedia
- For background, we touched on the electromagnetic spectrum, the laws of thermodynamics, and where energy comes from. For fun, try googling "Does all energy come from the sun, to find the interesting exceptions.
- If you're really keen, there's a basic energy balance model you can play with at Wolfram
- There's an even simpler model, using a spreadsheet, at ClimatePrediction.net. It's intended for High School students, but is still worth looking at. See, in particular, the instructions and the Excel spreadsheet itself
Homework (there's no class on Thursday, so read these for next week):
- Chapters 3 and 4 of the Dessler textbook. Dessler goes into a little more detail on the Physics than we did in class, so if there's anything you don't understand, ask about it in class next week.
|
Week 3
Tues
Sept 25
and
Thurs
Sept 27 |
No Class!

|
Notes:
- Well, unfortunately we had to cancel Tuesdays class due to illness. But we would have talked about how to turn the simple ideas about energy balance equations from last week into a simple computer model that we can experiment with.
Homework (for Thursday's class):
- Make sure you can log onto the blog. Try editing a blog post to get familiar with the controls.
- ...and for next week, you'll be working on your first graded assignment.
- Now would also be a good time to read the first chapter of Donella Meadows' book "Thinking in Systems"
|
Week 4
Tues
Oct 2
and
Thurs
Oct 4 |
Basic Computer Models
 |
Notes:
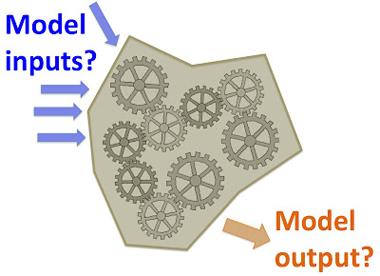
- We talked about how to turn the energy balance equation into a model that we could play with. If you're still unclear on what I mean by a 'model', this article might help.
- If you treat an equation as a model, it means you can play with any of the variables, and see how that affects other variables. The variables you try changing can then be thought of as 'inputs' and the ones that are affected are 'outputs' from the model.
- The same model can be set up with different choices of input and output. For example, we did experiments where: (i) albedo was the input, and temperature was the output; (ii) the solar constant was the input and temperature was the output; (i38ii) emissivity was the input and temperature was the output. The spreadsheet I used to do all the calculations is here.
- We played a game called Triangles, which demonstrated that highly interconnect systems are hard to change, but also that it takes time for a system to settle down into an equilibrium. If we make a change to the earth system (e.g. like in any of the experiments above), how long will it take the earth to settle into it's new equilibrium?
Homework (for Thursday's class):
- No extra homework as you're busy working on your first assignment this week.
|
Week 5
Tues
Oct 9
and
Thurs
Oct 11 |
Forcings and Feedbacks
 |
Notes:
- We took at look at the simulation models of the greenhouse effect at Phet.
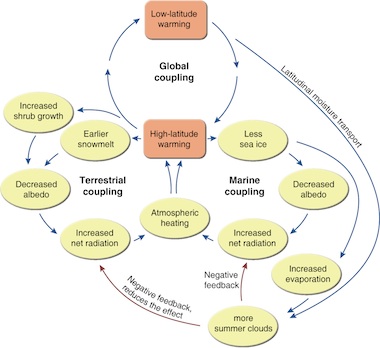
- We spent some time exploring the IPCC's diagram of where the energy goes, and in particular, which points on this diagram represent forcings and which are feedbacks (hint: it depends on what field of science you're in!).
- We did an exercise that demonstrated how reinforcing and balancing feedback loops work. The first two chapters of Meadows book explains these concepts very well. For a brief overview, see also this excellent overview of causal loop diagrams. Note: in much of the scientific literature, these are called positive and negative feedback loops. I prefer the terms 'balancing' and 'reinforcing', as they are more meaningful. A balancing loop tends to move a system towards a stable state, and keep it there; a reinforcing loop tends to accelerate a change away from a stable state.
Homework (read this week, even though there's no class on Thursday):
- Chapter 6 of Dessler's book (on Forcing, feedbacks, and climate sensitivity)
- Chapter 1 of Meadows's book, if you haven't already looked at it.
|
Week 6
Tues
Oct 16
and
Thurs
Oct 18 |
Exponential Growth and its limits
 |
Notes:
- We talked about the power of exponential growth, and how hard it is to understand the nature of such growth. For another explanation see Chris Martenson's Crash course
- The example we played with was folding a sheet of paper. After 33 folds (if that were possible) we calculated the paper would be more than 5,000km thick - approximately the distance between Toronto and London, England. Here's a spreadsheet with the math.
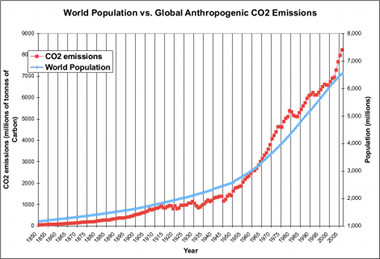
- We also started to look at human population growth, and noted that the current world population, 7 billion people, is approximately 33 doublings from a single person, and it's taken since 1968 to double from 3.5 billion to 7 billion.
- We looked a a number of exponential curves related the the idea of the Anthropocene - the fact that humans are now the dominant source of change to our planet's biosphere. The graphs came from a 2011 paper by Steffen et al
- We talked a little about limits to growth, and the possibility of collapse. To explore this further, see Jorgen Rander's essay "Global collapse—Fact or fiction?", and Jared Diamond's book Collapse: How Societies Choose to Fail or Succeed.
- You might also enjoy the Impossible Hamster
- You can explore the idea of population crashes yourself using this rabbits-and-wolves simulation
Homework (read this for Thursday's class):
- The chapter of Dessler's book on exponential growth
|
Week 7
Tues
Oct 23
and
Thurs
Oct 25 |
History of Climate Science
 |
Notes:
- We explored my timeline of the history of climate science.
- For more detail on the history of climate science, see Spencer Weart's The Discovery of Global Warming
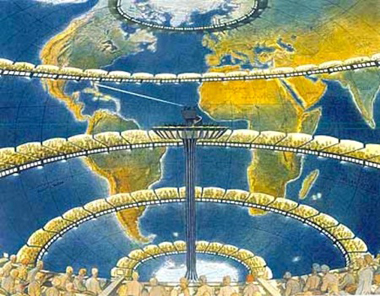
- The picture to the left is a depiction of Richardson's "Forecast Factory", in which he imagined 64,000 people, arranged on balconies inside a huge sphere, representing the globe, each computing the weather for their own grid square. If you want to read more about Richardson's work, Peter Lynch wrote a book on it.
Homework:
- Read chapter 13 of Dessler's book on the history of climate science
- Note: For Thursday's class, we'll be attending Kirsty Duncan's talk
|
Week 8
Tues
Oct 30
and
Thurs
Nov 1 |
Lines of Evidence
 |
Notes:
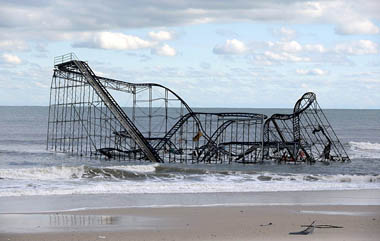
- We talked a lot about Hurricane Sandy. Here are some spectacular photos of the damage (and here's the one that looked like a scene from Titanic). For more on what was unusual about Sandy, try this article at NCAR. On CNN, Ben Orlove talks about the connection between Sandy and climate change, and, from the AGU blogs, What Those Who Understand Atmospheric Physics Are Talking About After Sandy. For some lessons about our ability to heed the warnings from scientists, see Chris Mooney's post NASA Warned New York About Hurricane Danger Six Years Ago
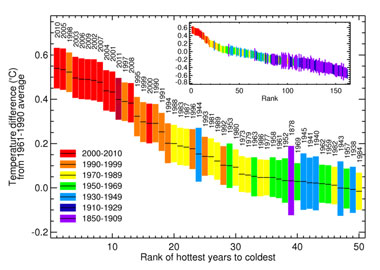
- We started to look a the data on climate change (especially temperature reconstructions). There's a whole gallery of temperature reconstructions here.
- The chart of hottest years in rank order shown on the left is from the UK Met Office.
- We talked a little about the BEST project from Berkeley. Here are there charts from the project, and here is an OpEd in the NY Times by Prof Muller, talking about how the project changed his perspective.
- For an overview of the role of CO2 in the Earth's history, see Richard Alley's Bjerknes Lecture
Homework (read this for Thursday's class):
- Now's the time to go back and read chapter 2 of Dessler's book, if you skipped it earlier.
|
Week 9
Tues
Nov 6
and
Thurs
Nov 8 |
Impacts
 |
Notes:
- We listened to the Muse track The Second Law: Unsustainable. The song addresses some of the themes we're talking about in the course.
- We talked a little about impacts, but especially one impact that's rarely discussed in textbooks: The psychological impact. For some people, thinking and worrying about climate change can induce a kind of climate trauma. If you start finding yourself overwhelmed or depressed about the future, read Gillian Caldwell's tips on staying sane. See also this very helpful advice from the Australian Psychological Association
- We talked a little about the question of how to talk to kids about climate change. I like James Hansen's letter to his granddaughter.
- We did an exercise called "postcard stories" to explore how changes can lead to reinforcing and balancing feedback loops. Remember that a reinforcing feedback loop keeps pushing a change further and further in the same direction. We've looked at lots of reinforcing feedback loops that have bad outcomes (population growth, climate feedbacks, etc). But remember that there are ways to get reinforcing feedback loops to work for us - start a movement, and if you structure it right it can take on a life of its own. This is how small changes (things we as individuals can do) can go on to make a huge difference in the world.
- For an all-in-one place set of links to recent papers on impacts of climate change, see this post at Think Progress
Homework (read this for Thursday's class):
- Read chapter 9 of Dessler, on impacts. But beware - this chapter is a long list of bad things we can expect in the future. I recommend that before you read it, prepare something fun to do afterwards, preferably something that makes you laugh.
|
Week 10
Thurs
Nov 15 |
Fall Break
(NO TUESDAY CLASS)
|
No Tuesday class, but we'll begin the team presentations on Thursday. |
Week 11
Tues
Nov 20
and
Thurs
Nov 22 |
Solutions to Climate Change
 |
Notes:
- We talked about targets for limiting climate change and where they come from:
- And then we considered some of the model studies that examined which emissions trajectories might get us there, and a simplified version of this analysis: the ski hills graph.
- We did an exercise (pole lowering) which emphasized the need for collective action, and we spent some time looking at this graphic, which shows a whole bunch of things people can do about climate change, but misses the point about collective action.
|
Week 11
Tues
Nov 27
and
Thurs
Nov 29 |
Geoengineering
 |
Notes:
- See the list of useful articles on geoengineering on my blog from earlier this year.
- We spent time looking at this graphic of geo-engineering ideas from Next Nature. A key observation is that none of these proposals tackles the root cause, namely growing GHG emissions from burning of fossil fuels. Hence, they are really more like medicine we take to alleviate the symptoms of flu; none of the will actually cure the problem. However, some of them may be useful to help to buy us more time (e.g. a decade or so) in which to get emissions under control, before the worst effects kick in.
- We also considered Alan Robock's essay 20 Reasons Why Geoengineering May Be A Bad Idea.
- The image to left is, of course, Munch's The Scream, which may have been inspired (in part) by vivid red sunsets due to a volcanic eruption; sulphate seeding of the stratosphere is likely to produce similar vivid red sunsets.
- We did an exercise in finding connections using a ball of coloured wool. This lead us to a discussion of convergent thinking versus divergent thinking, and we observed that many people who talk about geoengineering approach it using convergent thinking, expecting that if we work at it, we can find "the solution" to climate change. But climate change is a wicked problem with complex inter-dependencies. There is no one solution; instead we'll need many different strategies, each of which might help address some part of the challenge.
- Our discussion of divergent thinking reminded us of Sir Ken Robinson's talk on Changing Education Paradigms, in which he points to a study showing that kindergarten kids are really good at divergent thinking, but the education system knocks this out of them.
Homework (by next term!):
- Watch Ken Robinson's talk. It's not about climate change, but nevertheless is very relevant.
- Next term we'll start to look more closely at Donella Meadow's book on systems thinking, and we'll apply it to creating and experimenting with models. Now would be a good time to read chapter 2, "A brief visit to the Systems Zoo"
|
Week 12
Tues
Dec 4 only (last day of term) |
No class this week, as Steve is away
|
Notes:
- I'll be attending the Fall Meeting of the American Geophysical Union in San Francisco
- Highlight of the trip was a keynote talk by Ray Pierehumbert on Successful Predictions in Climate Science
|
| |
Seminar Topic |
Notes and Readings |
Week 1:
Tues
Jan 8 |
Analyzing Questions
 |
Notes:
- We talked about how to distinguish questions that can be answered by science versus questions that must be answered by society. The former have answers based on data we can collect, while the latter depend on value judgements (for example on ethics, priorities, equity, etc).
- We also talked a little about the role of modeling in science. For example, data and theory can tell us the world warms in response to extra greenhouse gases. But if we want to calculate the warming precisely, we need a model. We also have to eliminate some of the uncertainties. So instead of asking how warm it will get by any given year, we pose it as a "what if" question, for example, "what if we double the amount of CO2?". The doubling CO2 question is now a standard question in climate science, known as the Charney Sensitivity, and was first answered properly in 1979 by the Charney commission (see the original Charney report). We'll return to the role of models later in the term.
- We talked about Fermi Questions, which are problems where we have to estimate some quantity for which it's typically not possible to produce a precise answer, and where the key skill is the ability to decompose the question into a series of quantities that can be readily estimated, and combine them to give at least an order of magnitude estimate for the original question. See this extensive list of examples.
- We tried our hand at the question "How many piano tuners are there in Toronto" (without using the internet to help us), and came up with an answer somewhere between 10 and 20. the point of the exercise, of course, is not to get a perfect answer, but to figure out how to break the question down into a set of simpler things that we can make good estimates for.
|
Week 2:
Tues
Jan 15
and
Thurs
Jan 17 |
No Class!
|
|
Week 3:
Tues
Jan 22
and
Thurs
Jan 24 |
Designing Experiments

|
Notes:
- We attempted to analyze some Fermi-style questions relevant to climate change:
- Is it better (for the environment) to print out a document or read it on the screen?
- What’s the single most important thing you can do to reduce your carbon footprint?
- How many trees would you have to plant to remove the CO2 produced by one automobile?
- How much would the sea level rise if all ice on the planet melted?
- Is it possible to design a house heated only by human body warmth?
- In which year do you expect the last gasoline car in Ontario to be removed from the roads?
- We found that when we broke these questions down, we still needed to get some data to help answer them. We explored the question of whether to trust responses we
get from google searches, and the importance of tracing back to the primary sources for any data we use.
- As an example of the importance of tracing data back to primary sources, we talked about the example of the misquoted data on shrinking glaciers, in which the original data appears to be made up (it doesn't appear in any of the cited works in the original webpost), and even worse, then got changed from "55% of 625 glaciers" to "555 of 625 glaciers" by a typing mistake, which was then widely repeated by people who never checked the source of the data.
- We watched some videos of experiments on how the greenhouse effect works, and asked ourselves some questions:
|
Week 4:
Tues
Jan 29
and
Thurs
Jan 31 |
Finding Answers

|
Notes:
- We did an exercise in class that required you to think outside the box. Science is often more creative than people realize. In school, they often make science sound like it's a whole series of prescribed procedures that you have to follow carefully, and it can seem very boring. Real science isn't like that - it involves lots of puzzles that have no obvious answers. Progress usually happens when someone comes up with a new way of looking at a problem.
- Of course, we also need some thinking outside the box if we are to address a problem as complex as climate change.
- We got a little off-track talking about the movie "The day after tomorrow", and I promised I'd post Kate's analysis of the science in the movie.
- We also talked a little about climate governance (because someone mentioned the Munk program in environmental governance). And we got on to the topic of fossil fuel subsidies. The folks at the International Institute for Sustainable Development have done loads of research on fossil fuel subsidies, including analysis of how much is being spent, and why.
- In Thursday's class we got sidetracked into a fascinating discussion about whether we can find another planet if we make a mess of this one. We tried the quiz in Tom Murphy's "Why Not Space?" blogpost, and talked about how much energy it really takes to leave the earth. The prospects don't look good!
|
Week 5:
Tues
Feb 5
and
Thurs
Feb 7 |
Exploring Models
|
Notes:
- We explored how science is really done (as opposed to how people think it's done), and spent some time discussing The 15 Myths of Science listed by William McComas.
- We also looked at the blog post on how scientists use models by Tamsin Edwards, from her blog "All Models are Wrong".
- We did an exercise where we had to balance poles on our fingers, which emphasized the importance of looking at the right variables.
- On Thursday, we spent more time looking at some of the models on the list I compiled in a blog post ("Simple Models to Play with In the Classroom"). We already looked at:
|
Week 6:
Tues
Feb 12
and
Thurs
Feb 14 |
Recap: So what is a model really?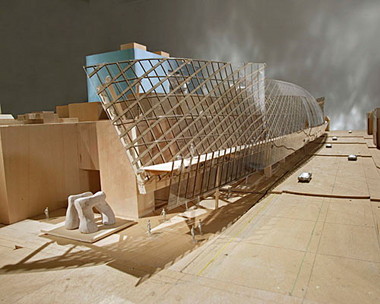
|
Notes:
- We brainstormed some examples of models, including fashion models, clay models, architectural models, equations, computer models, etc.
- The common feature is that a model stands in for something else, and is usually a simplification. It's often easier and more insightful to work with the model, rather than the real thing. But note that a model always leaves some stuff out - so we have to be careful when working with a model to understand this, and to be careful what conclusions we draw.
- We identified three types of model:
- Physical models which usually have the same shape/form as the real thing (e.g fashion models, architectural models, toy cars, etc.);
- Conceptual models which help us think about more complex systems (e.g. Venn diagrams, the idea of the water cycle, etc)
- Computational models, which allow us to calculate properties of the real system (e.g. equations for geometry (we looked at equations for area and sides of a right angled triangle), climate models, etc)
- We also explored how computational models tend to chain several equations together to do more complicated analysis.
- We looked at two simple calculations (i.e. models!):
|
Week 7: |
No class
(Reading Week)
|
|
Week 8:
Tues
Feb 26
and
Thurs
Feb 28 |
Understanding Accumulation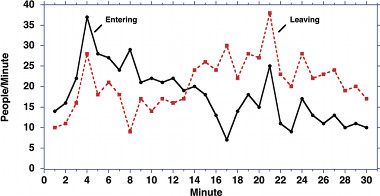
|
Notes:
- We did a number of exercises that explored how well we understand accumulation:
- The department store exercise (illustrated on the left) comes from: Cronin, M., Gonzalez, C., & Sterman, J. D. (2009). Why don’t well-educated adults understand accumulation? A challenge to researchers, educators, and citizens. Organizational Behavior and Human Decision Processes, 108(1), 116–130.
- The simplified department store exercise, from Sterman, J. D. (2010). Does formal system dynamics training improve people’s understanding of accumulation? System Dynamics Review, 26(4), 316–334.
- We played a little with the bathtub model.
- We talked a little about the idea of "owed" warming, and what would happen if we were able to zero all emissions immediately, using ideas from a recent talk by Damon Matthews.
|
Week 9:
Tues
Mar 5
and
Thurs
Mar 7 |
System Delays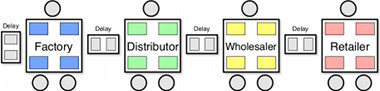
|
Notes:
- We played the beer game!
- You can read more about the origin of the beer game and how it has been used in teaching systems thinking in this paper by John Sterman.
- Of course, the main point of the beer game is to think about how lack of communication and delays in systems lead to strange dynamics.
|
Week 10:
Tues
Mar 12
and
Thurs
Mar 14 |
The dynamics of delay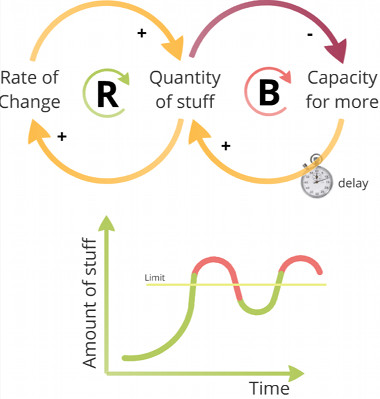
|
Notes:
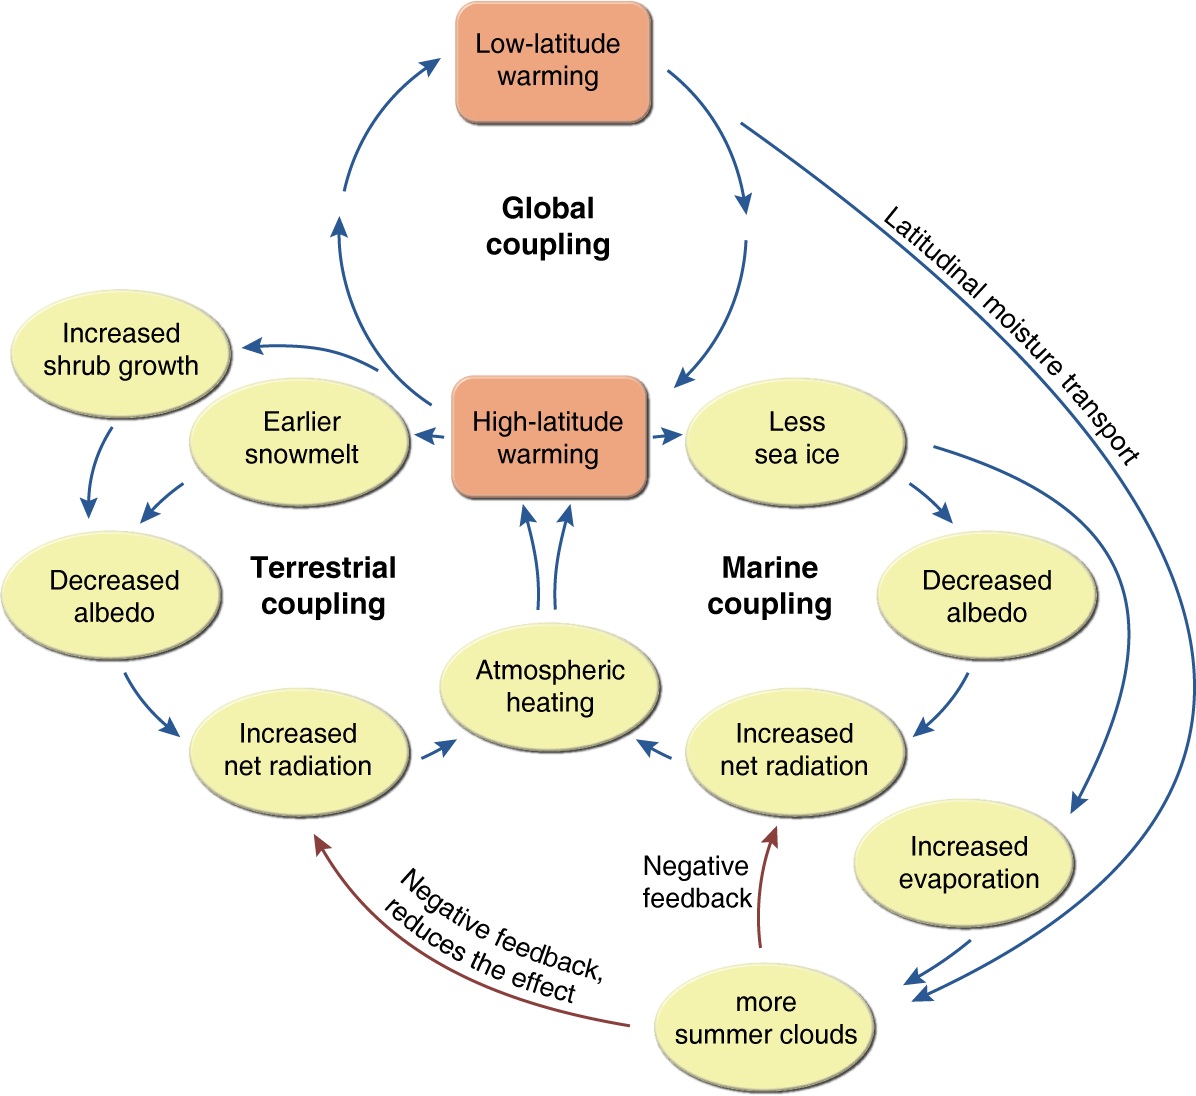
- We talked about feedback loops in the climate system, and I presented some examples in a Prezi
|
Week 11:
Tues
Mar 19
and
Thurs
Mar 21 |
Solving Climate Change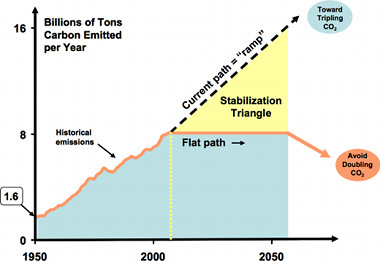
|
Notes:
- We played the Wedges game. You can read more about this game at the Princeton website, including the original papers.
- Robert Socolow wrote an update on the wedges game in 2011, in which he points out that as we haven't really started work on any of the wedges, we now have to work that much harder at them.
- More recently, Davis et al published a deeper look at the wedges, and conclude that we need far more than Socolow's 8-9 wedges, if we are to take the latest climate model results seriously.
|
Week 12:
Tues
Mar 26
and
Thurs
Mar 28 |
Fixes that Fail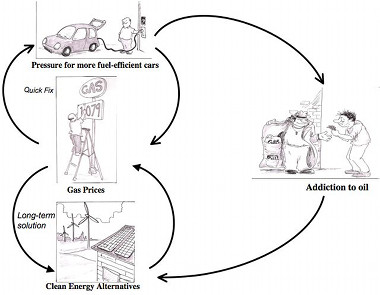
|
Notes:
- We explored how some of the systems traps described in chapter 5Donella Meadows' book apply to climate change.
- Here's the prezi I showed with examples of these systems traps.
|
Week 13:
Tues
Apr 2
and
Thurs
Apr 4 |
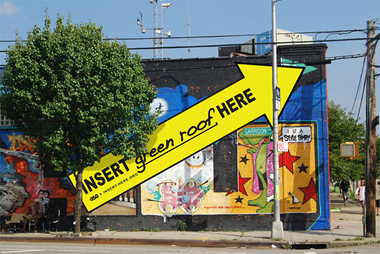
Space for Living
|
Notes:
- We talked about solutions to climate change, and how to categorize them, using the systems concepts we've covered in the course, and categorized them in three groups (after Meadows' chapter 6 on leverage points:
- Low leverage strategies: Changing the variables, altering the flows. Altering taxes & fees, voting for the other party, and most geoengineering schemes fit here. As none of them alter the positive feedback loops driving the exponential growth of fossil fuel use, none can really make much difference to processes that drive climate change;
- Medium leverage strategies, including strengthening negative feedback loops, weakening positive feedback loops, and altering the length of delays in the system. These include work on curbing population growth, pricing carbon, removing fossil fuel subsidies, and speeding up deployment of renewable energy technologies. All these tackled the key feedback loops, and hence have a strong change of altering the system behaviour.
- High leverage strategies, including changing people's mindsets and the rules of the system, and teaching people systems thinking. These strategies include electoral reform, new forms of corporation, and new measures of economic wellbeing, such as Gross National Happiness.
- Here's how the IMF figures that the current social cost of carbon is $25 per tonne (and hence that's what we should be taxing it at), along with a critique of the analysis.
- Here's an overview of the problems of fossil fuels subsidies from Skeptical Science
- We mentioned B Corporations, as a new way of thinking about what companies should do.
- And we mentioned alternative indicators such as Gross National Happiness.
|
We can include any of these based on interest and enthusiasm (but probably not all of them!). Some of these stray away from the "computing" them of the course, so we might need to agree on some criteria for which ones to include. In no particular order:
There are 6 assignments for the course (3 in each term), each is worth 15% of the course grade:
Plus 10% of the course mark is for showing up for seminars and tutorials, and participating in the class blog.


