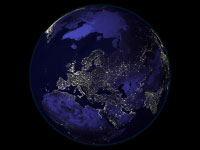
This is our planet. Our spaceship for traveling through the cosmos. It provides a life support system for many different forms of life. Look at all those lights, marking out the places where humans cluster in great cities. Where does all the energy come from to light up those cities? Remember, energy cannot be created or destroyed; it can only be transformed from one kind to another. Right now, most of that energy comes from burning fossil fuels (coal, oil, and natural gas) that have lain buried under the ground for millions of years.
- Image Credit: Smithsonian Institute. (Note: this is not a photograph, it is a composite image)
- See also: this amazing video of the earth from the international space station
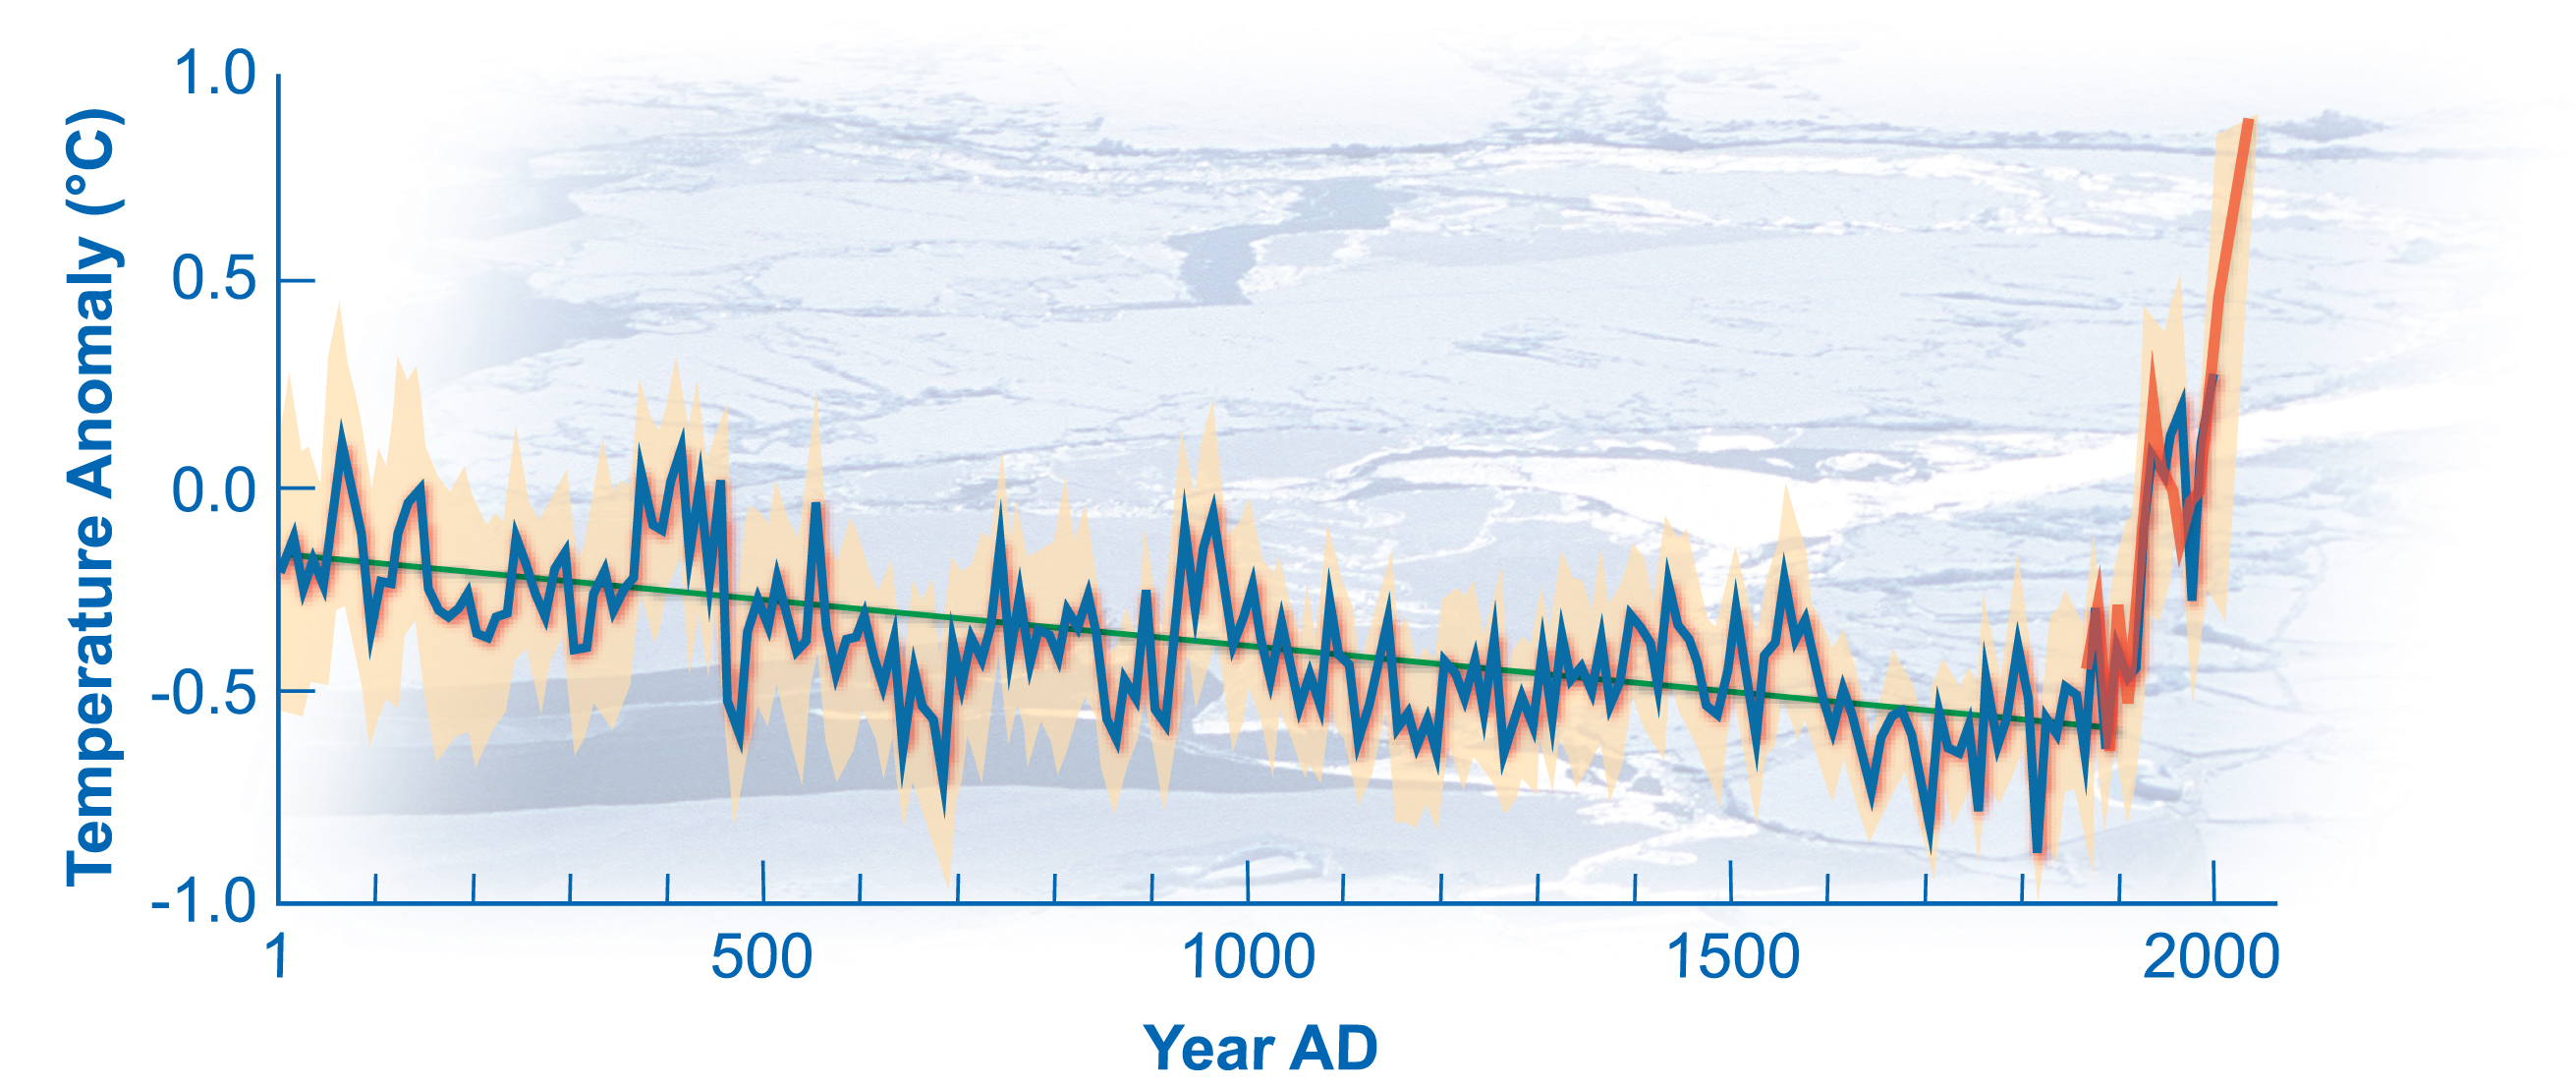
- Image Credit: National Centre for Atmospheric Research, "Arctic Warming Overtakes 2,000 years of Natural Cooling" 2009.

Many lines of evidence show the warming. For example, this graphs shows a number of different studies that have analyzed global temperatures over the 150 years since 1850. The further back you go, the more variability there is, because of differences in how temperature readings were taken. But over the 20th Century, the trend is clear: 40 years of strong warming until about 1940, then a slight slight cooling until the 1980s, and finally, a strong warming signal since then. The overall warming is very clear, but it's not the only variability in the graph - a good theory ought to explain the overall warming, as well as the the other, shorter patterns. We'll come back to that pattern of post-war cooling shortly. Note: when we talk about temperature changes ("anomalies"), we have to say change with respect to what. The usual convention is to take the average temperature from the last quarter of the 20th Century, and call that zero; temperatures colder than this will be shown as negative, temperatures warmer will be shown as positive. In this particular graph they used the average from the period 1961-1990 as "zero". We'll need to check carefully what "zero" means on any temperature anomaly graph.
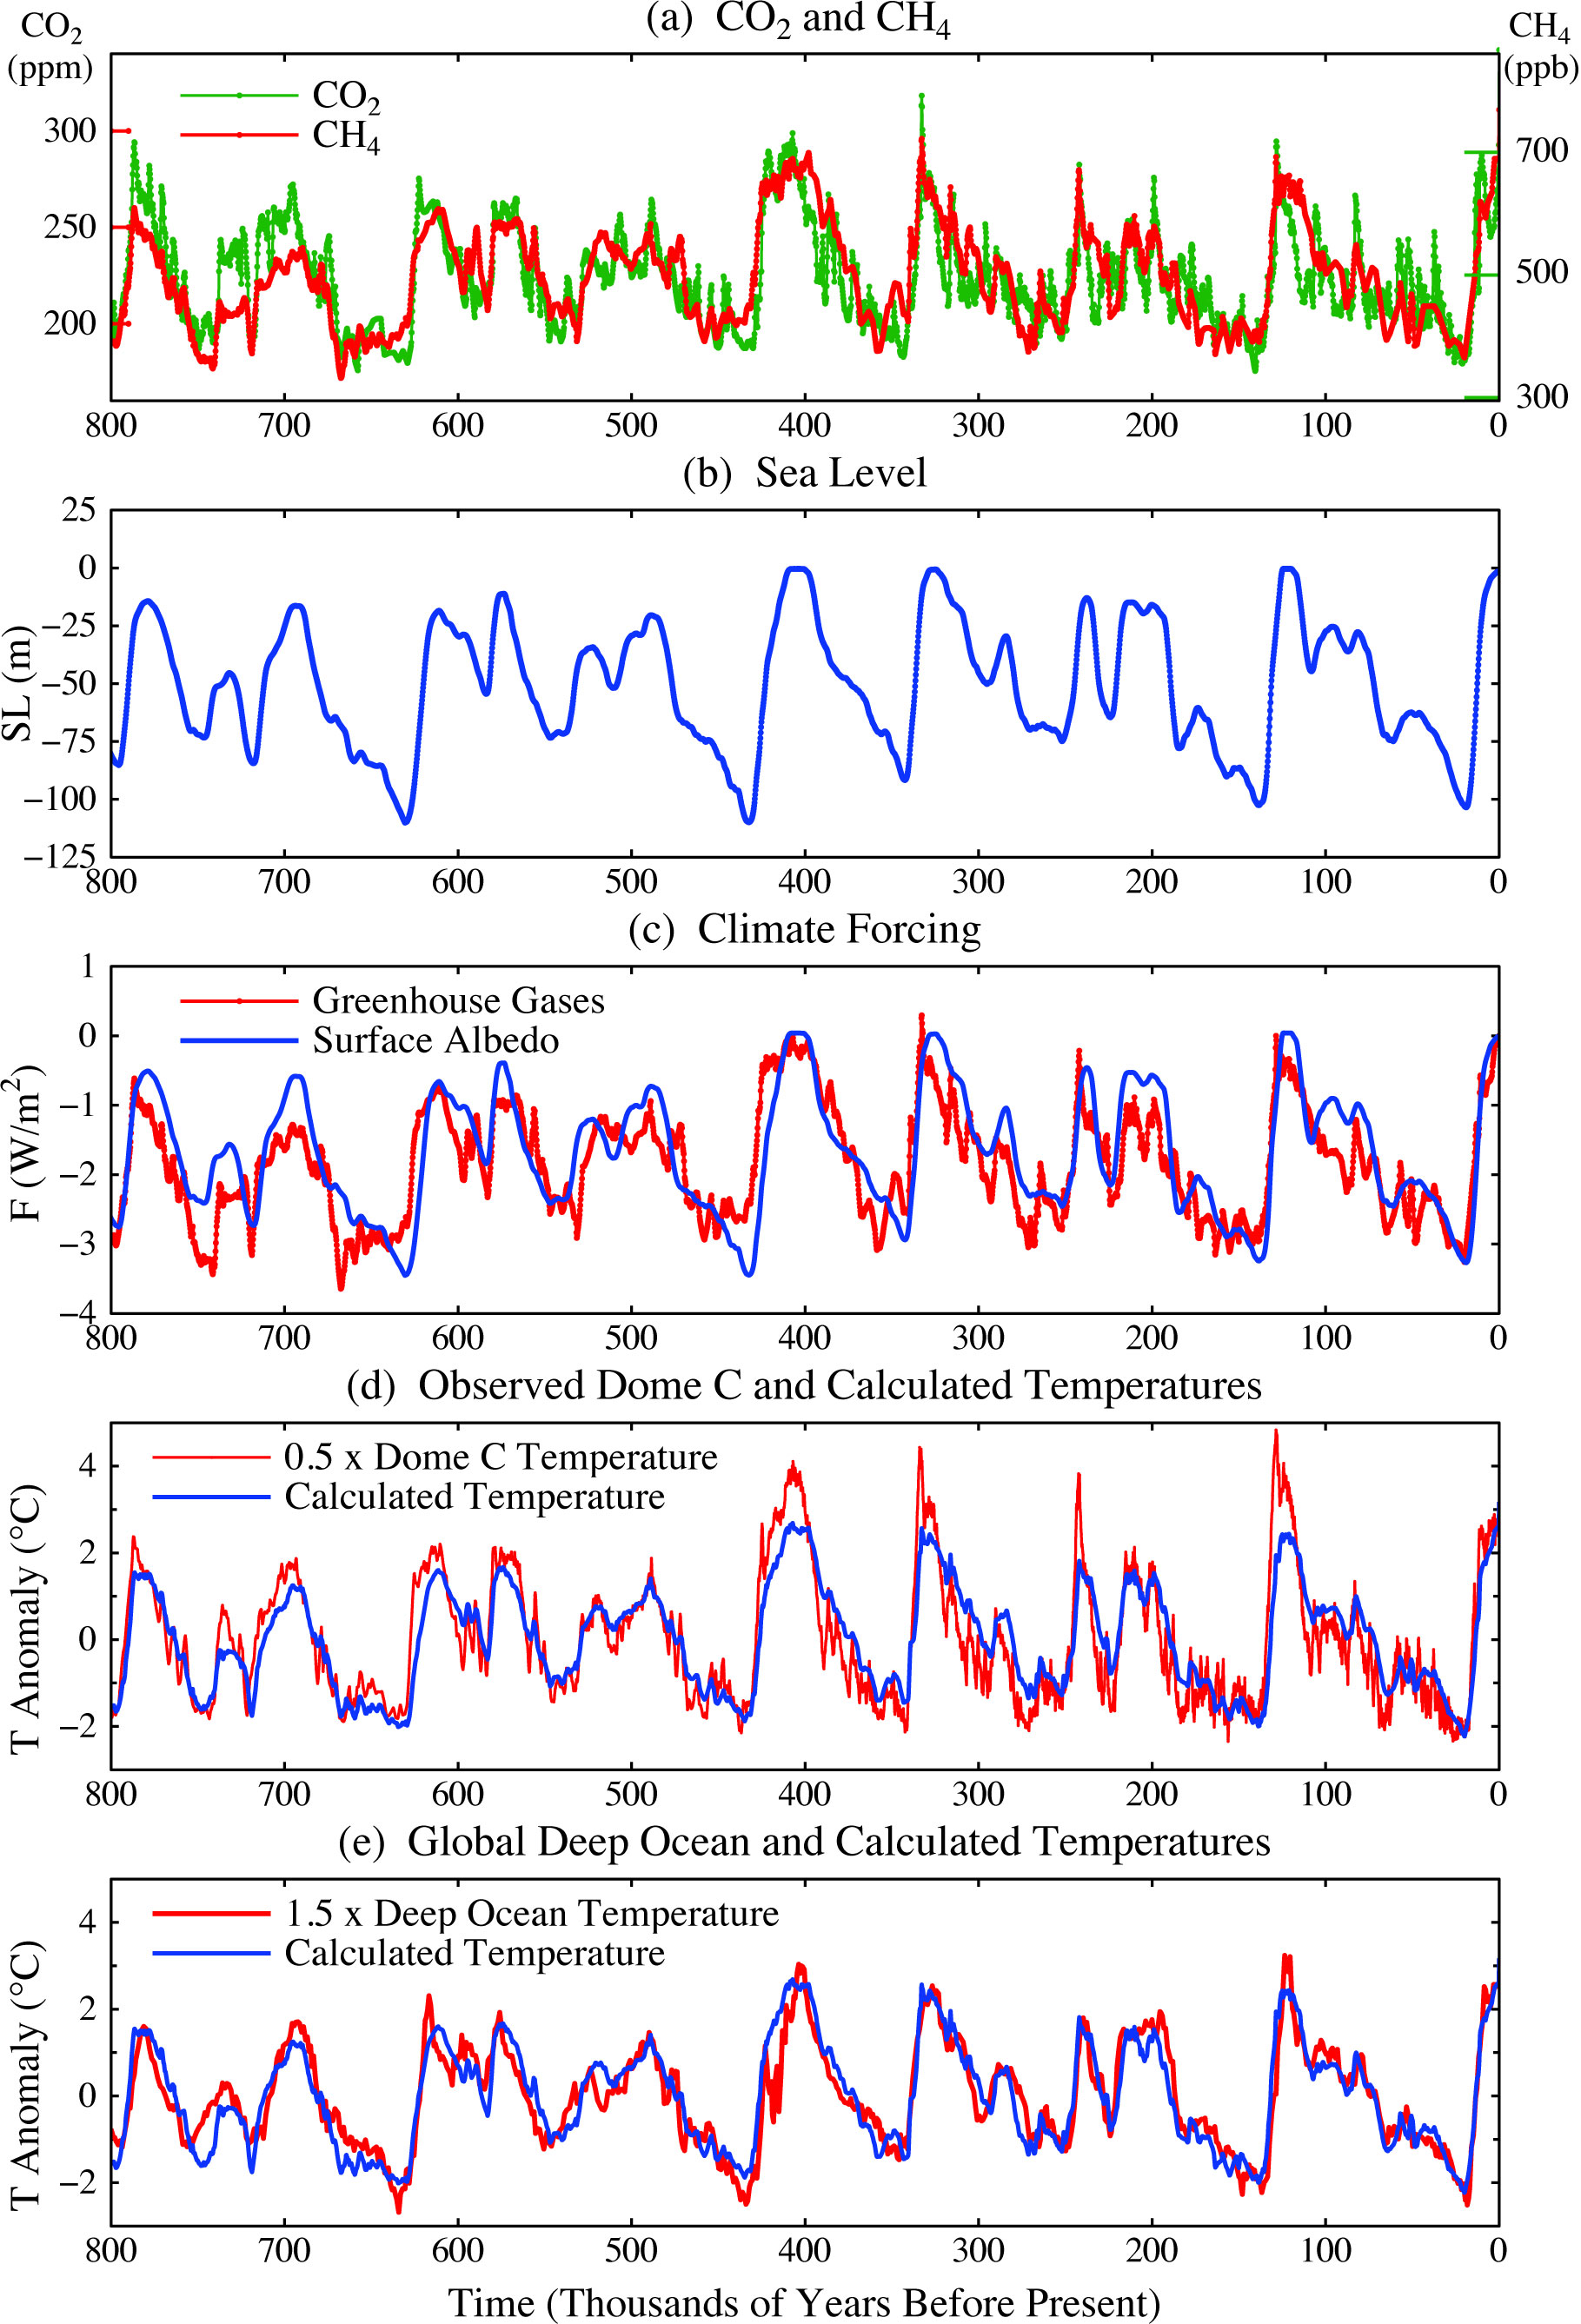
Such warming has happened before. This graph shows the global temperature estimates over the last 800,000 years, reconstructed from the oldest ice core, the Epica Dome C. The troughs in the graph were the ice ages, when ice sheets more than a kilometre thick expanded across North America and Northern Europe. The peaks are the inter-glacials, when the ice retreated. Note that the global temperature difference between the ice ages and the interglacials is only around 4-5°C. The ice ages were triggered by the Milankovitch Cycles, changes in the earth's orbit, which alter the amount of sunlight at the poles. However, the orbital variations aren't big enough to cause this much temperature change. Rather, they act as a trigger. For example, as an ice age ends, the orbital change causes a very slight warming. This in turn triggers two feedback effects: a release of carbon dioxide trapped in the ice, and a reduction of the earth's albedo as the ice sheets melt. Both these effects in turn cause a lot more warming. At the start of an ice age, a similar sequence causes the cooling process.
- Image Credit: Hanson & Sato, 2011, Paleo-climate implications for human-made climate change.
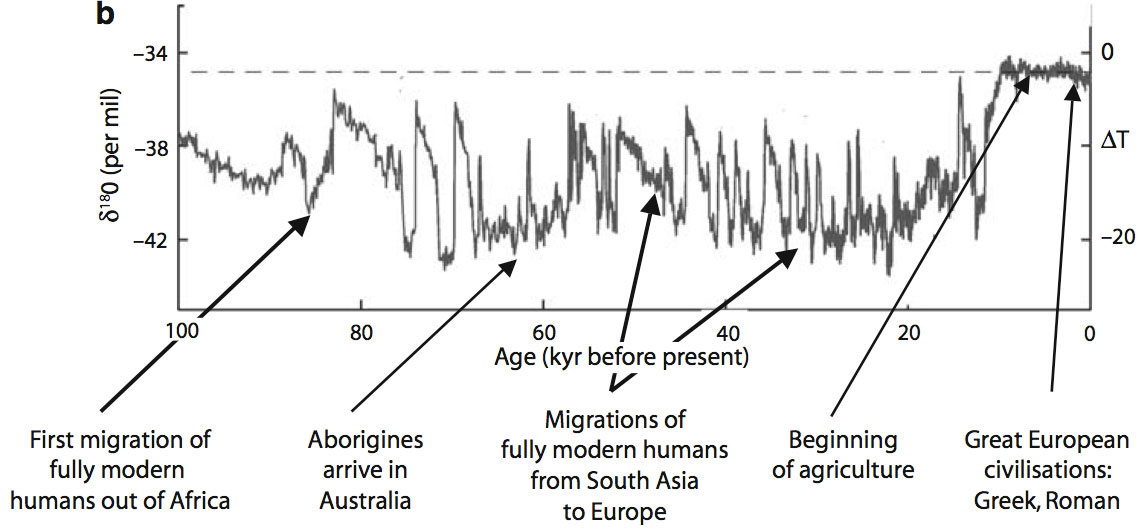
But human civilization wasn't around last time we had massive climate shifts. In fact, in the last 10,000 years, the period in which humans transitioned from hunter-gathers to an agricultural society, saw a remarkably stable period in the earth's climate. This graph, of Greenland temperature variations, shows just the last 100,000 years. The last ice age ended about 10,000 years ago. Note: This graph, from the Greenland ice sheet project (GISP), plots local temperatures in Greenland, rather than global temperatures. The corresponding global temperature shift at the end of the last ice age was about 5°C.
- Image Credit: Young and Steffen, 2009, "The Earth System: Sustaining Planetary Life-Support Systems"
Greenhouse gas concentrations rose steadily throughout the 20th Century, with the growth much faster in the last few decades. In the post-war economic boom, the warming this caused was offset by increasing industrial pollutions (particles like Sulphur Dioxide, which block incoming sunlight), Then, in the 1970's with the advent of clean air legislation in Europe and N. America, the warming dominates again.