Welcome to the main results page. This site houses the aggregated results
of various tests with belief propagation techniques such as BP, SP, and their
Expectation-Maximization variations.

    Currently the results are divided amongst problem set, then heuristic, then
results for each metric given the problem set / heuristic. Click [here] to view
the results.

    For each of the heuristics used, we selected the variable with the strongest
belief and set the variable to the direction of the belief. The setting was propagated
(unit prop) and then repeated. This continued until either the problem was
solved or we have eliminated all possible models.

    To help you get started, here are some intro explanations to what some of
the results signify:


This is a single frame from the 2d Movie's shown in the various results.
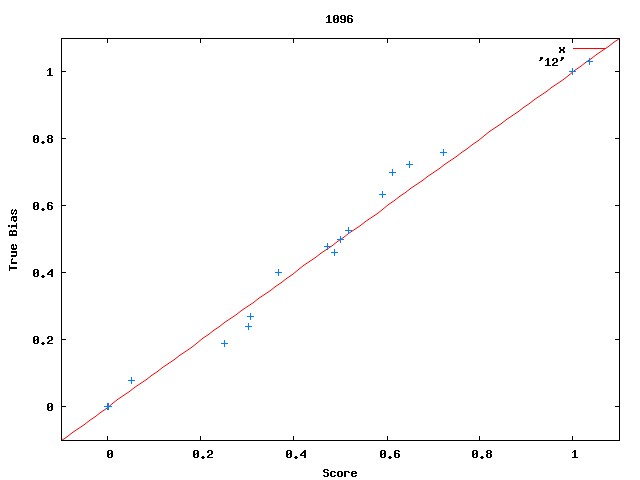
The x-axis is the calculated positive bias of a variable setting, and the
y-axis is the true positive bias (calculated through extensive model
counting). Each point represents an individual variable.

The number in the top right corner is the frame. This indicates how
many variables we have already set. The title of the plot indicates the
number of satisfying models that remain.
This is a 3d plot showing the estimated positive bias of different variables
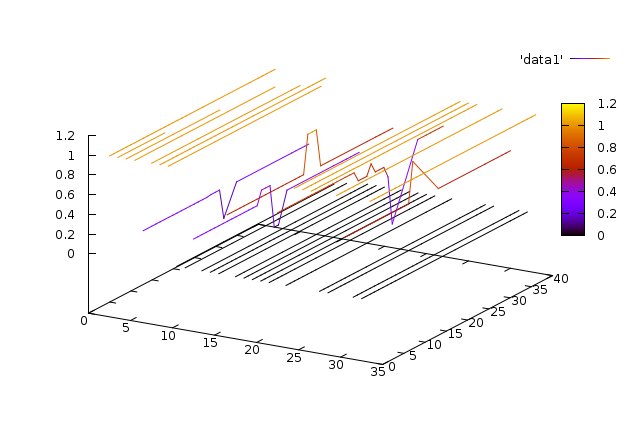
as time passes. The bottom axis (and each connected line) indicates the
individual variables in the problem. The side axis indicates the frame
(mentioned earlier. The vertical axis indicates the strength of the belief,
where 0 is fully positive and 1 is fully negative.


    There are a number of statistics recorded for each of the runs. Here we present a
brief description of each of them:

Note: The first 5 metrics are measure of error. At each frame in solving, we have an
estimated and actual positive bias of every variable. The various error calculations
are simply various ways of comparing the estimate and actual, and then averaged over
all of the variables (using mean).

LegendNameDescription
MEMean ErrorAverage of the distance between the estimated positive bias and actual values.
MCEMean Consequential ErrorAverage of the distance between the estimated positive bias and actual values when the prediction is wrong.
MRERoot Mean Relative ErrorSquare root of the average distance between estimated positive bias and actual values, normalized by the actual value.
RSSRoot Sum of SquaresSquare root of the sum of the squares of the difference between the estimated positive bias and actual values.
RMSERoot Mean Squared ErrorSquare root of the average of the squares of the difference between the estimated positive bias and actual values.
MBMean BiasThe mean strength of the actual positive bias.
MEBMean Estimated BiasThe mean strength of the estimated positive bias.
BBTBack Bone ThresholdPercentage of backbones guessed correctly over a given threshold for the estimated positive bias.
ERElimination RatioThe percentage of satisfying models eliminated.
ERTElimination TallyThe number of satisfying models that remain.