Wireshark
Darshan & Raj
Wireshark Overview
Wireshark is a network protocol analyzer created by Gerald Combs in 1998. It is used for:- network troubleshooting,
- analyze and examine security problems,
- software and communications protocol development,
- education and hacking.
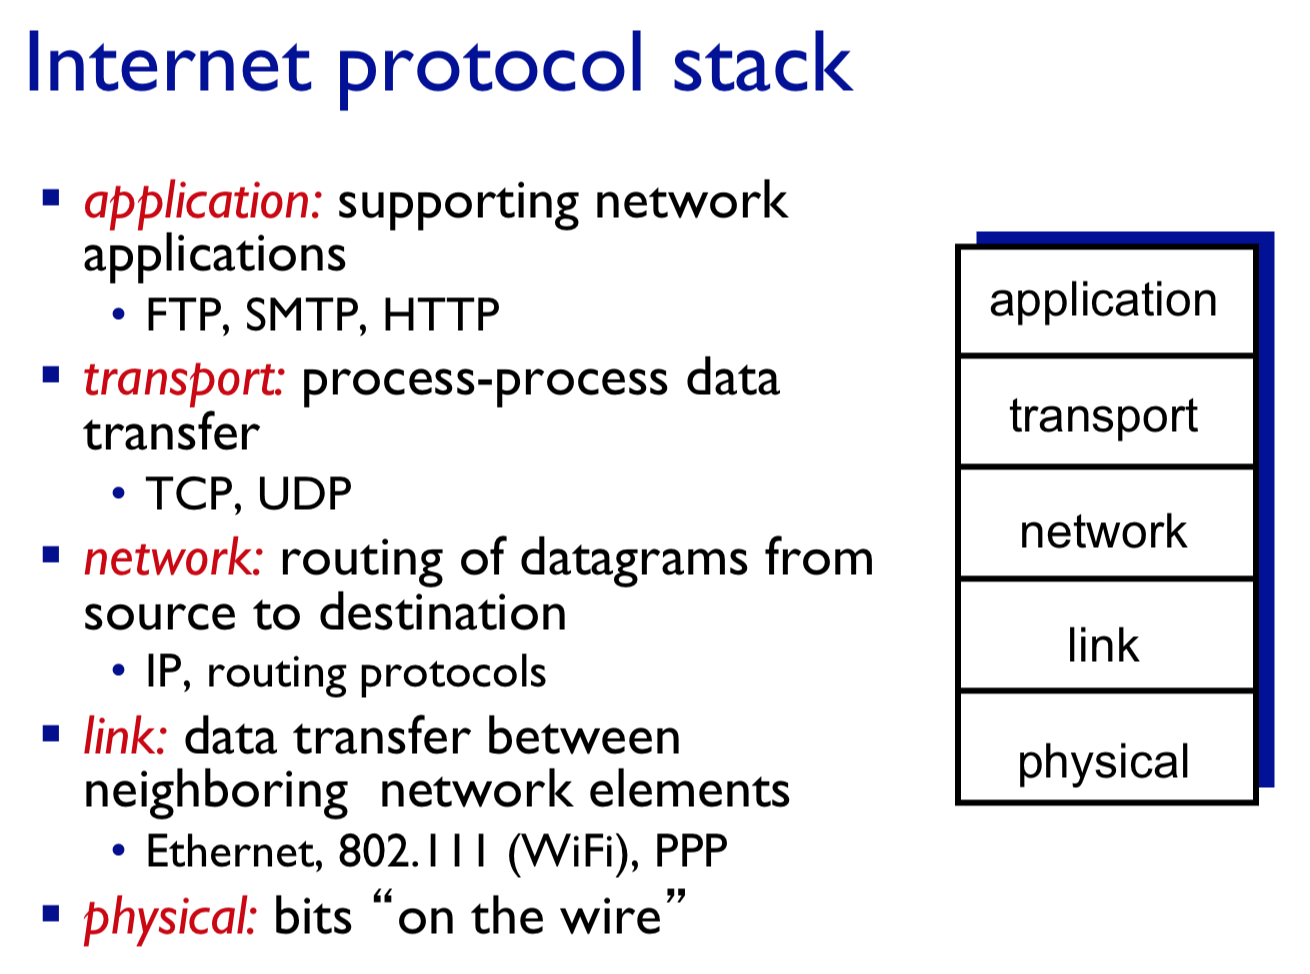
Wireshark captures network information from the Application Layer to the Link Layer.
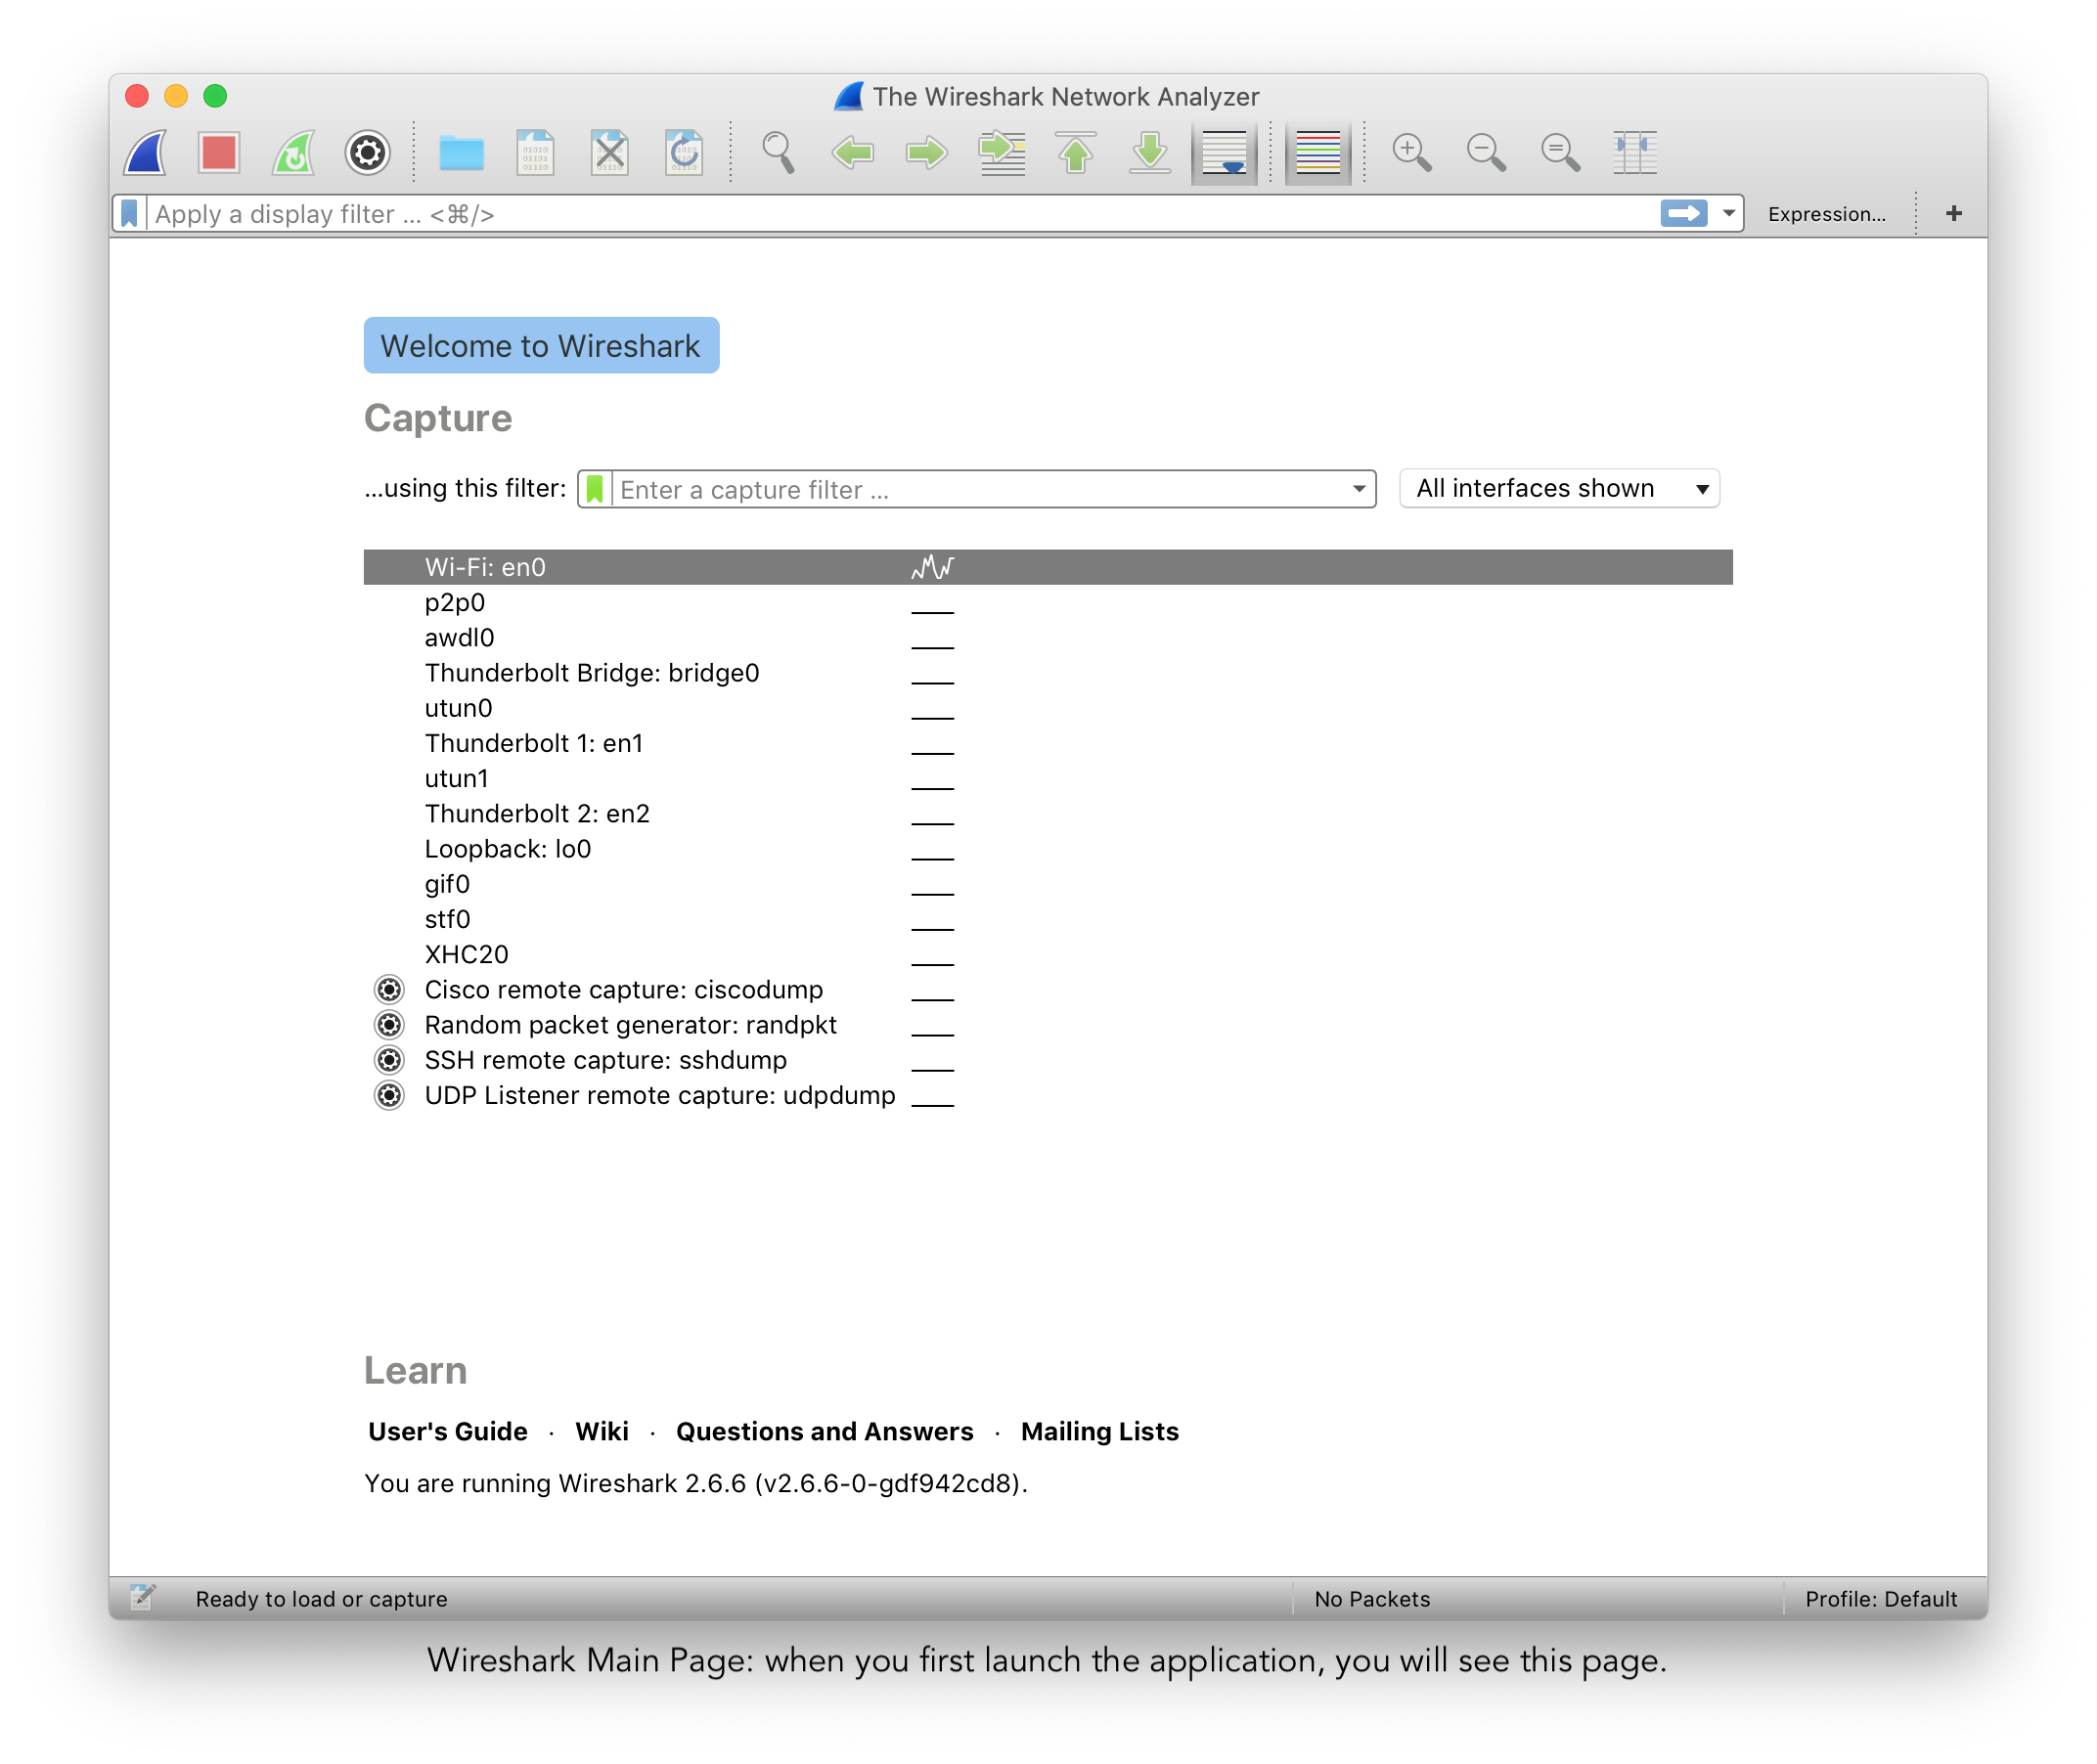
This is Wiresharks landing page.
Starting from the top:
- The 'Capture' button begins the network capture.
- 'All Interfaces shown' drop down menu allows you to select between Wired, Wireless and External interfaces. In our case, we have all three showing. A wired interface would be the built-in Thunderbolt ports I have. 'awdl0' is for my bluetooth chip and 'Loopback: lo0' is for my local server.
- To capture more than one interface, simply hold the 'command' key (for Mac) and then select. Once selected, press Capture.
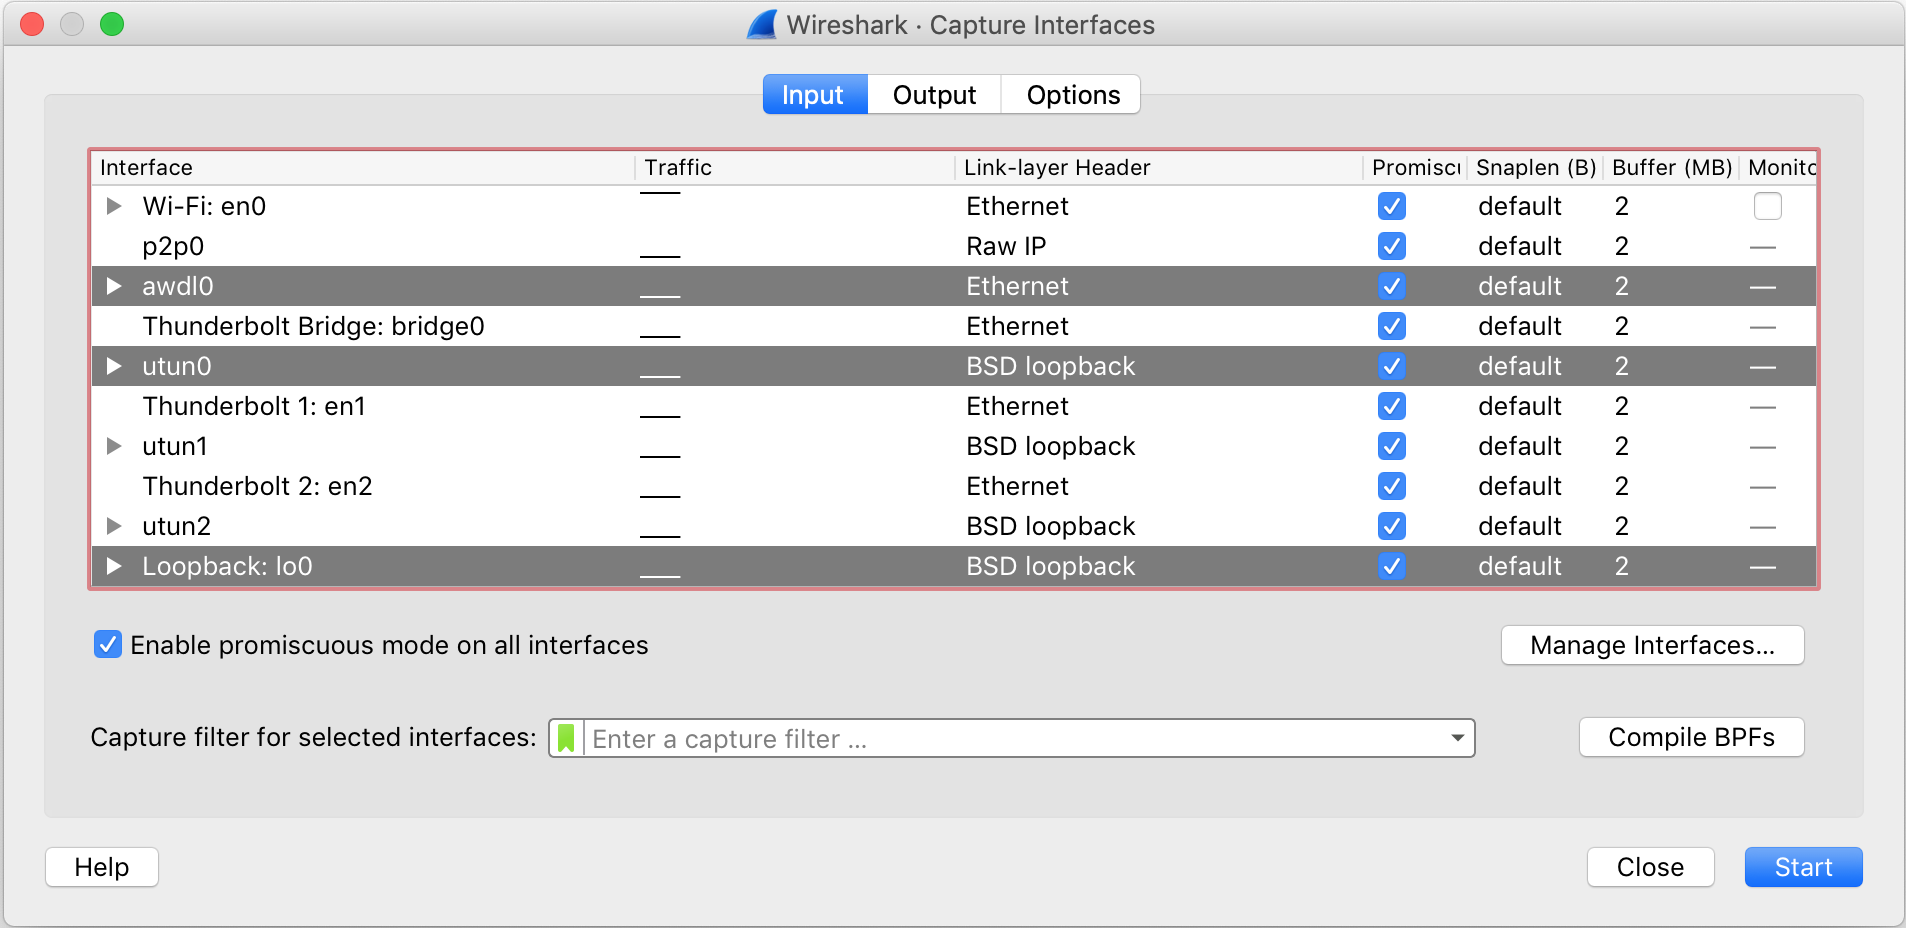
After you click capture, the following display shows up confirming your selection and offers a few more configurations.
Promiscious Mode enabled means if a packet is not meant for your system, Wireshark will still keep a record of it. Sometimes, packets bounce of various hosts asking for a final destination -- at this point, Wireshark keeps the packet or discards based on this option.
When you begin capturing network packets, the following window will show up.
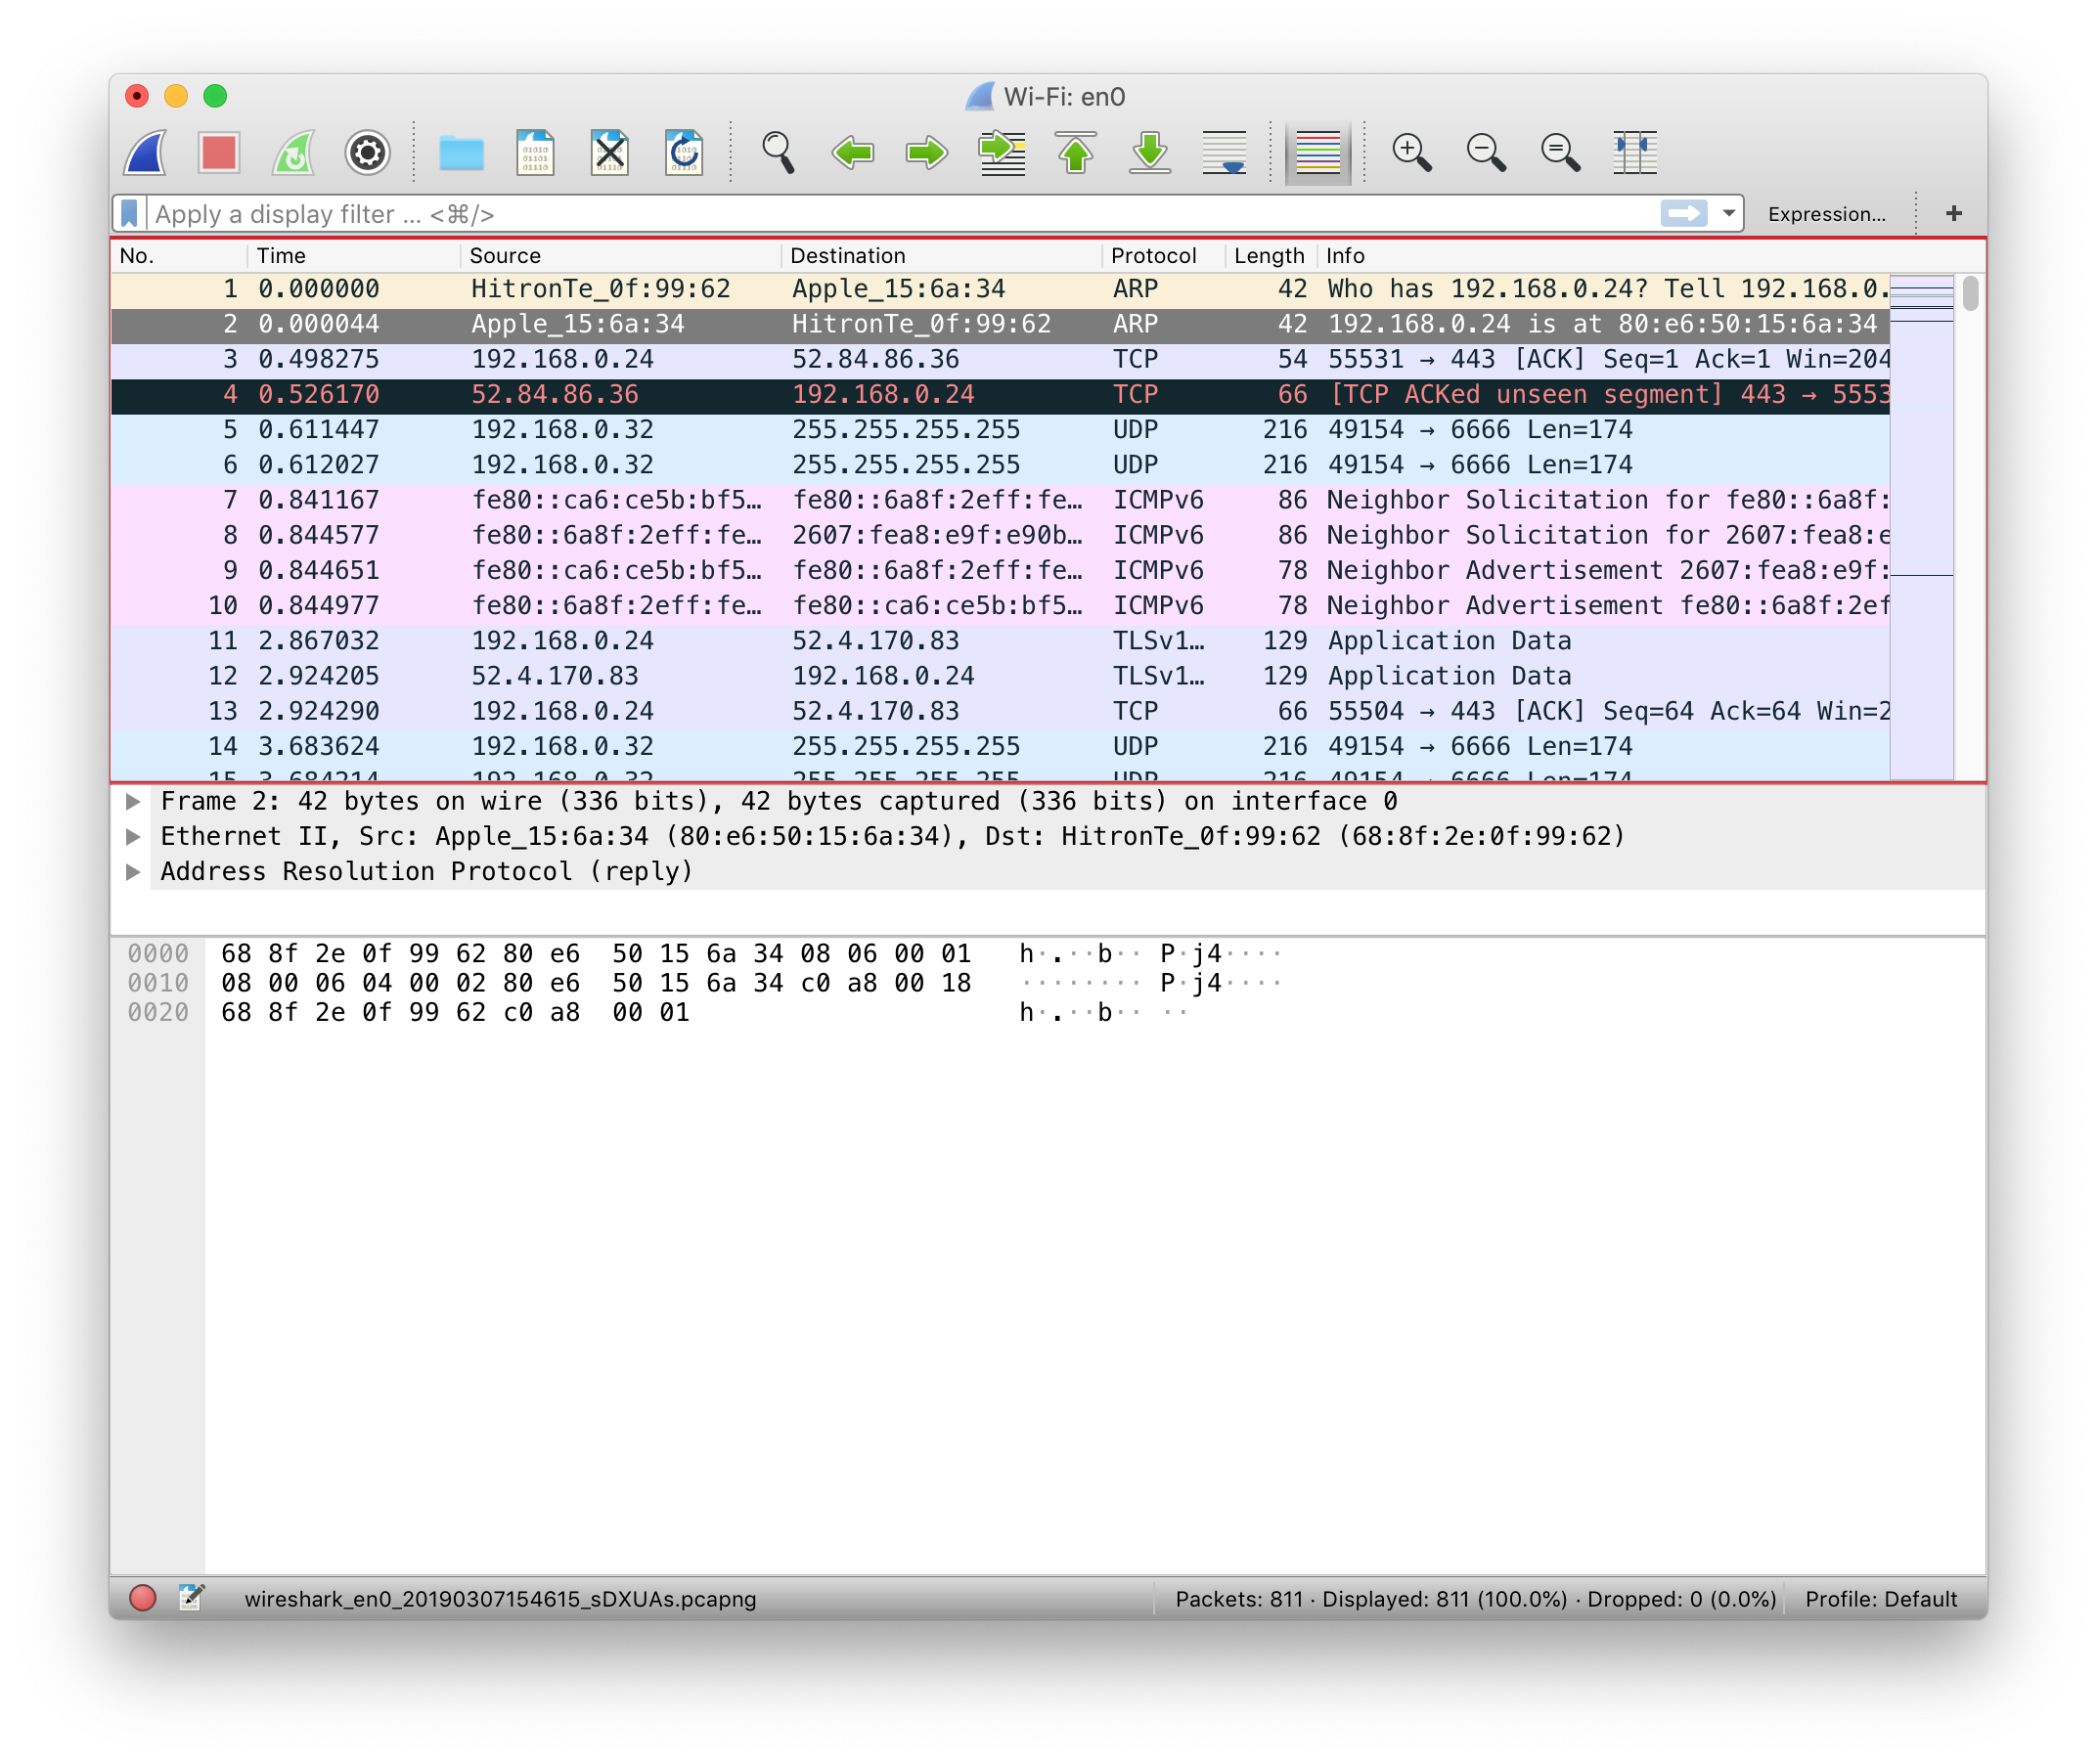
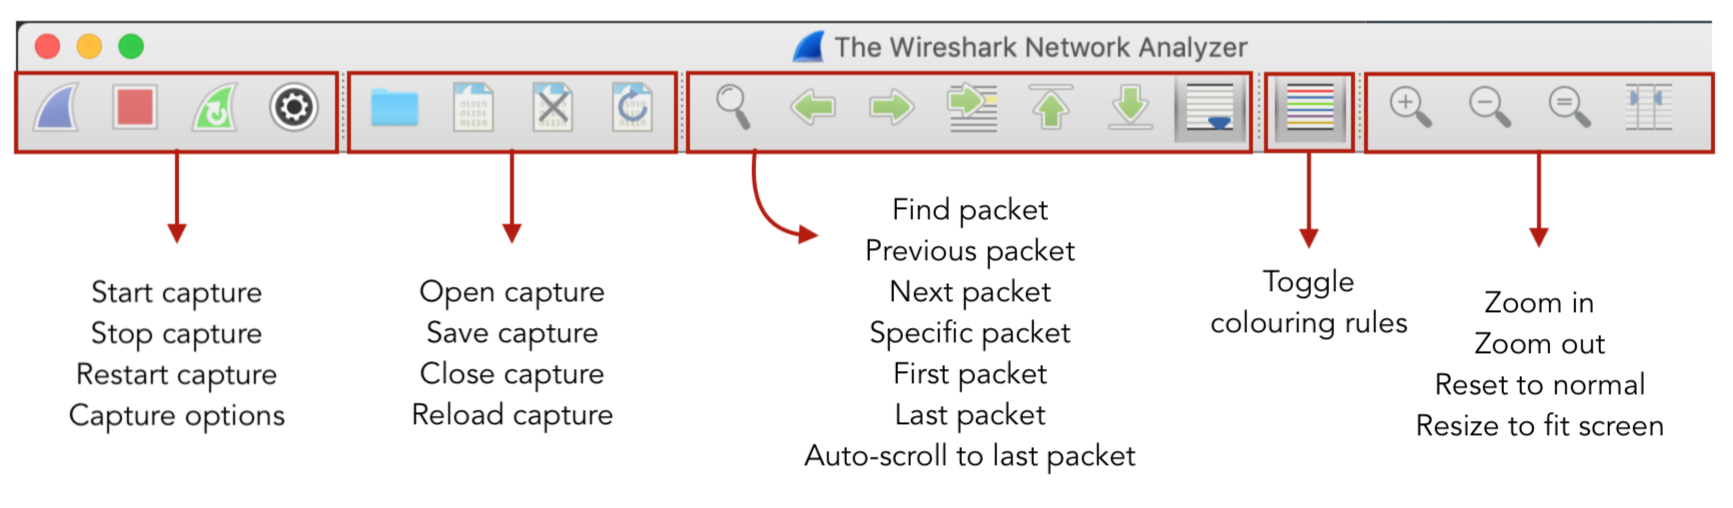
Here's a look at what the buttons on the toolbar do.
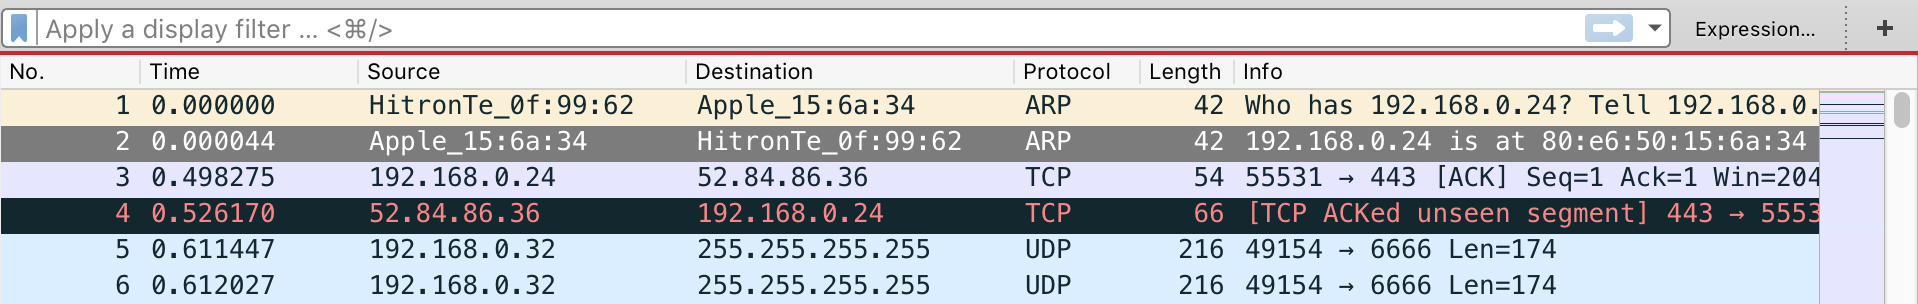
Right below the toolbar, there are seven columns:
Column Headers
- No – Each packet is assigned a number.
- Straight forward, it's just a counter.
- Time – The timestamp of the packet.
- a.k.a how much time passed since you began capturing.
- You can change this to various other time formats by going to "View > Time Display Format > ...".
- Source – Source address of the packet, could be an IP or MAC address.
- As humans, we find it easier when the IP or MAC address is an actual name, such as 'www.google.com' or 'www.yahoo.ca'. You can enable Wireshark's option to convert these addresses by going to "View > Name Resolution > Resolve Network Addresses".
- Destination – Destination address of the packet, could be an IP or MAC address.
- Protocol – Protocol name used in the packet.
- Protocol means "a set of rules governing the format of data sent over the Internet or other network." Click here for a complete list.
- Length – Total length of the packet.
- Info – Provides additional details about the packet.
- This Info view is just meant to be a quick view of what the packet is about. For more details, go down to the In-depth panel and the bytes panel for more details on the packet flags, source and destination ports, HTTP form data, and more!
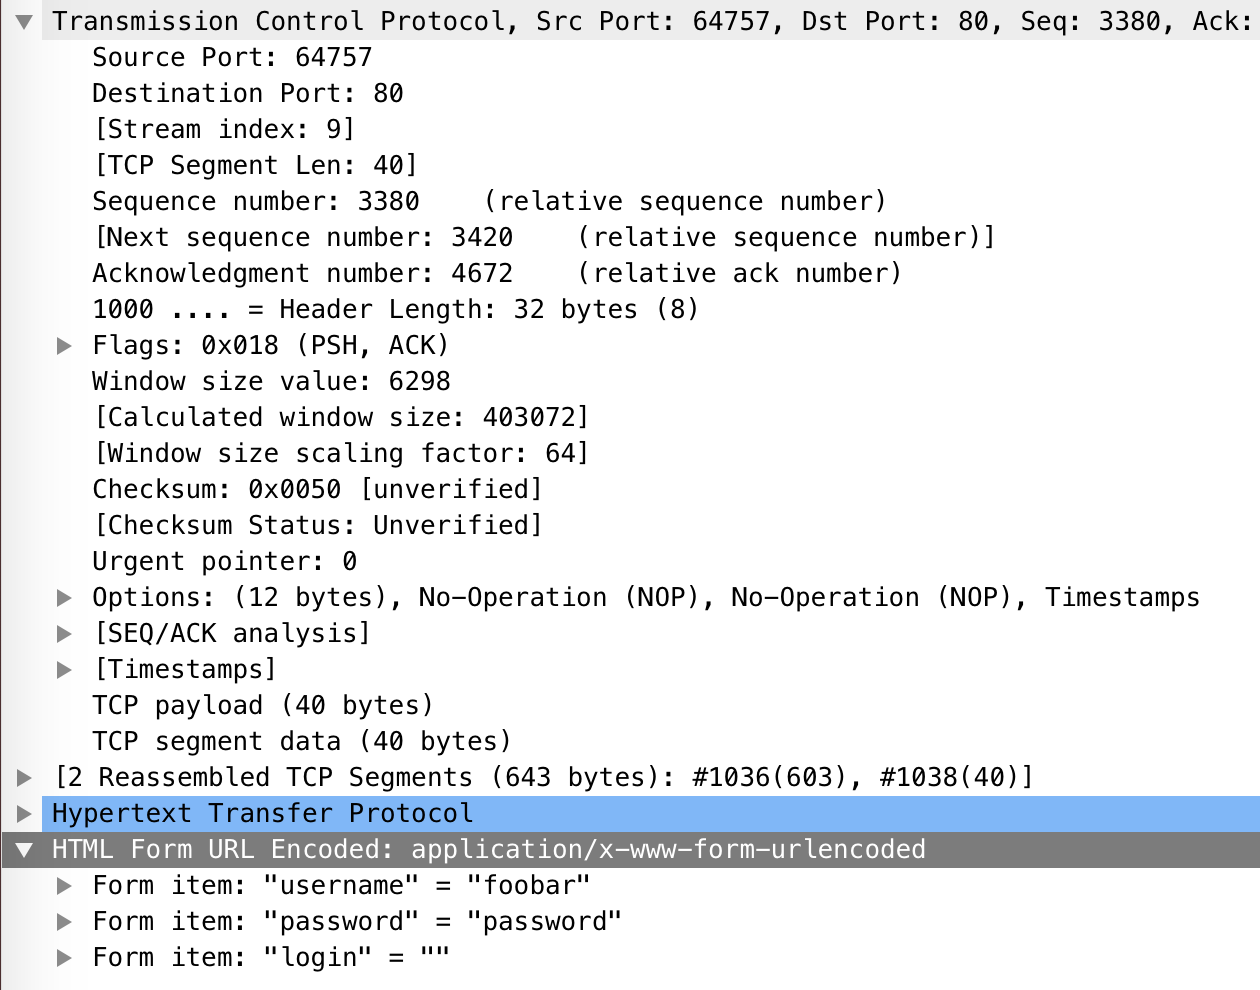
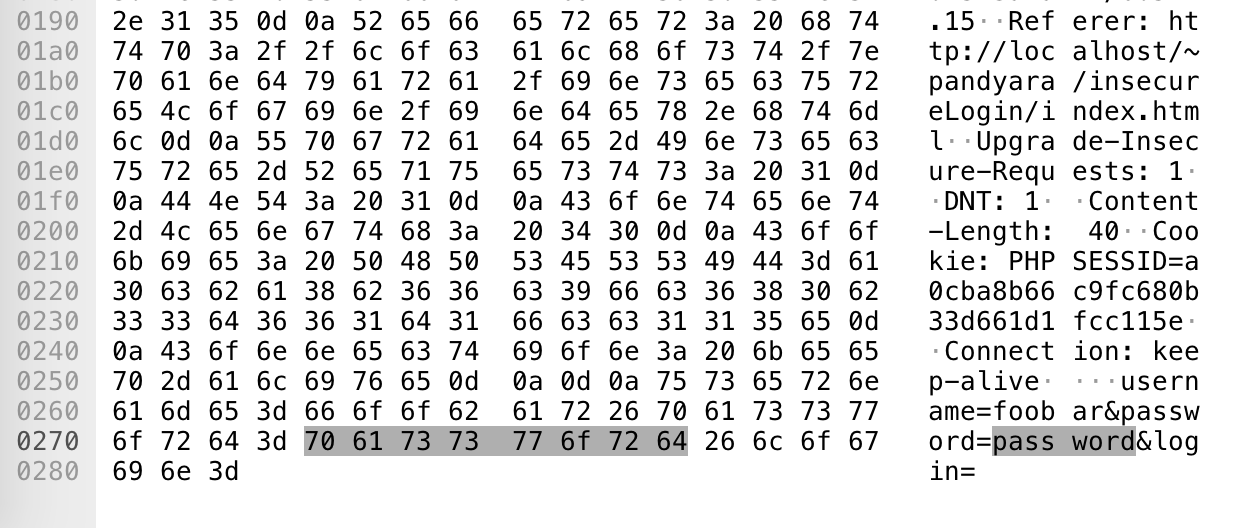
Here's a view of the in-depth and the bytes panel:
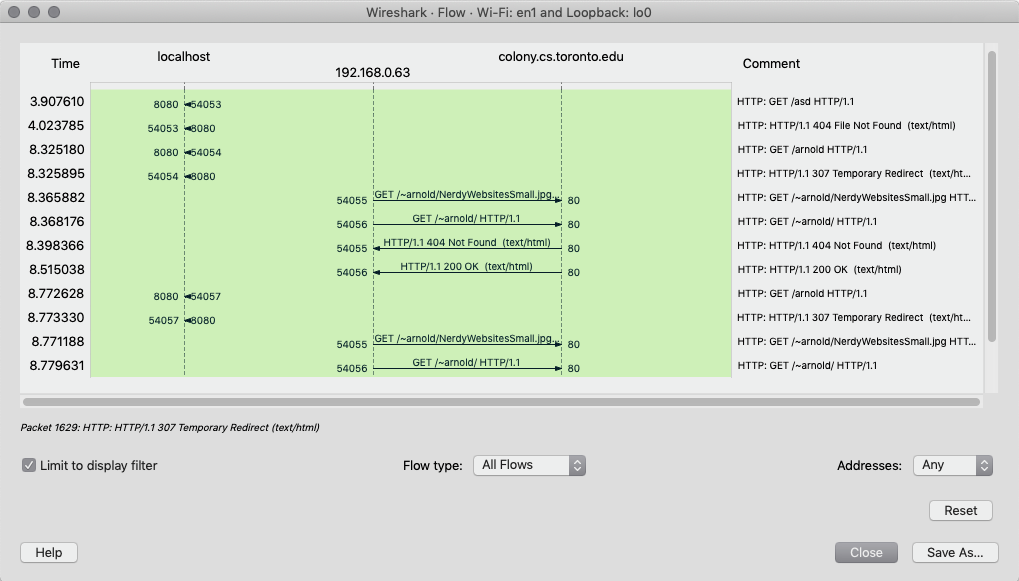
Flow Graph
Sometimes it's difficult to grasp a picture of how the packets are flying. Wireshark offers a Flow Graph (under Statistics tab) where you're able to see how the communication works between a server and client.
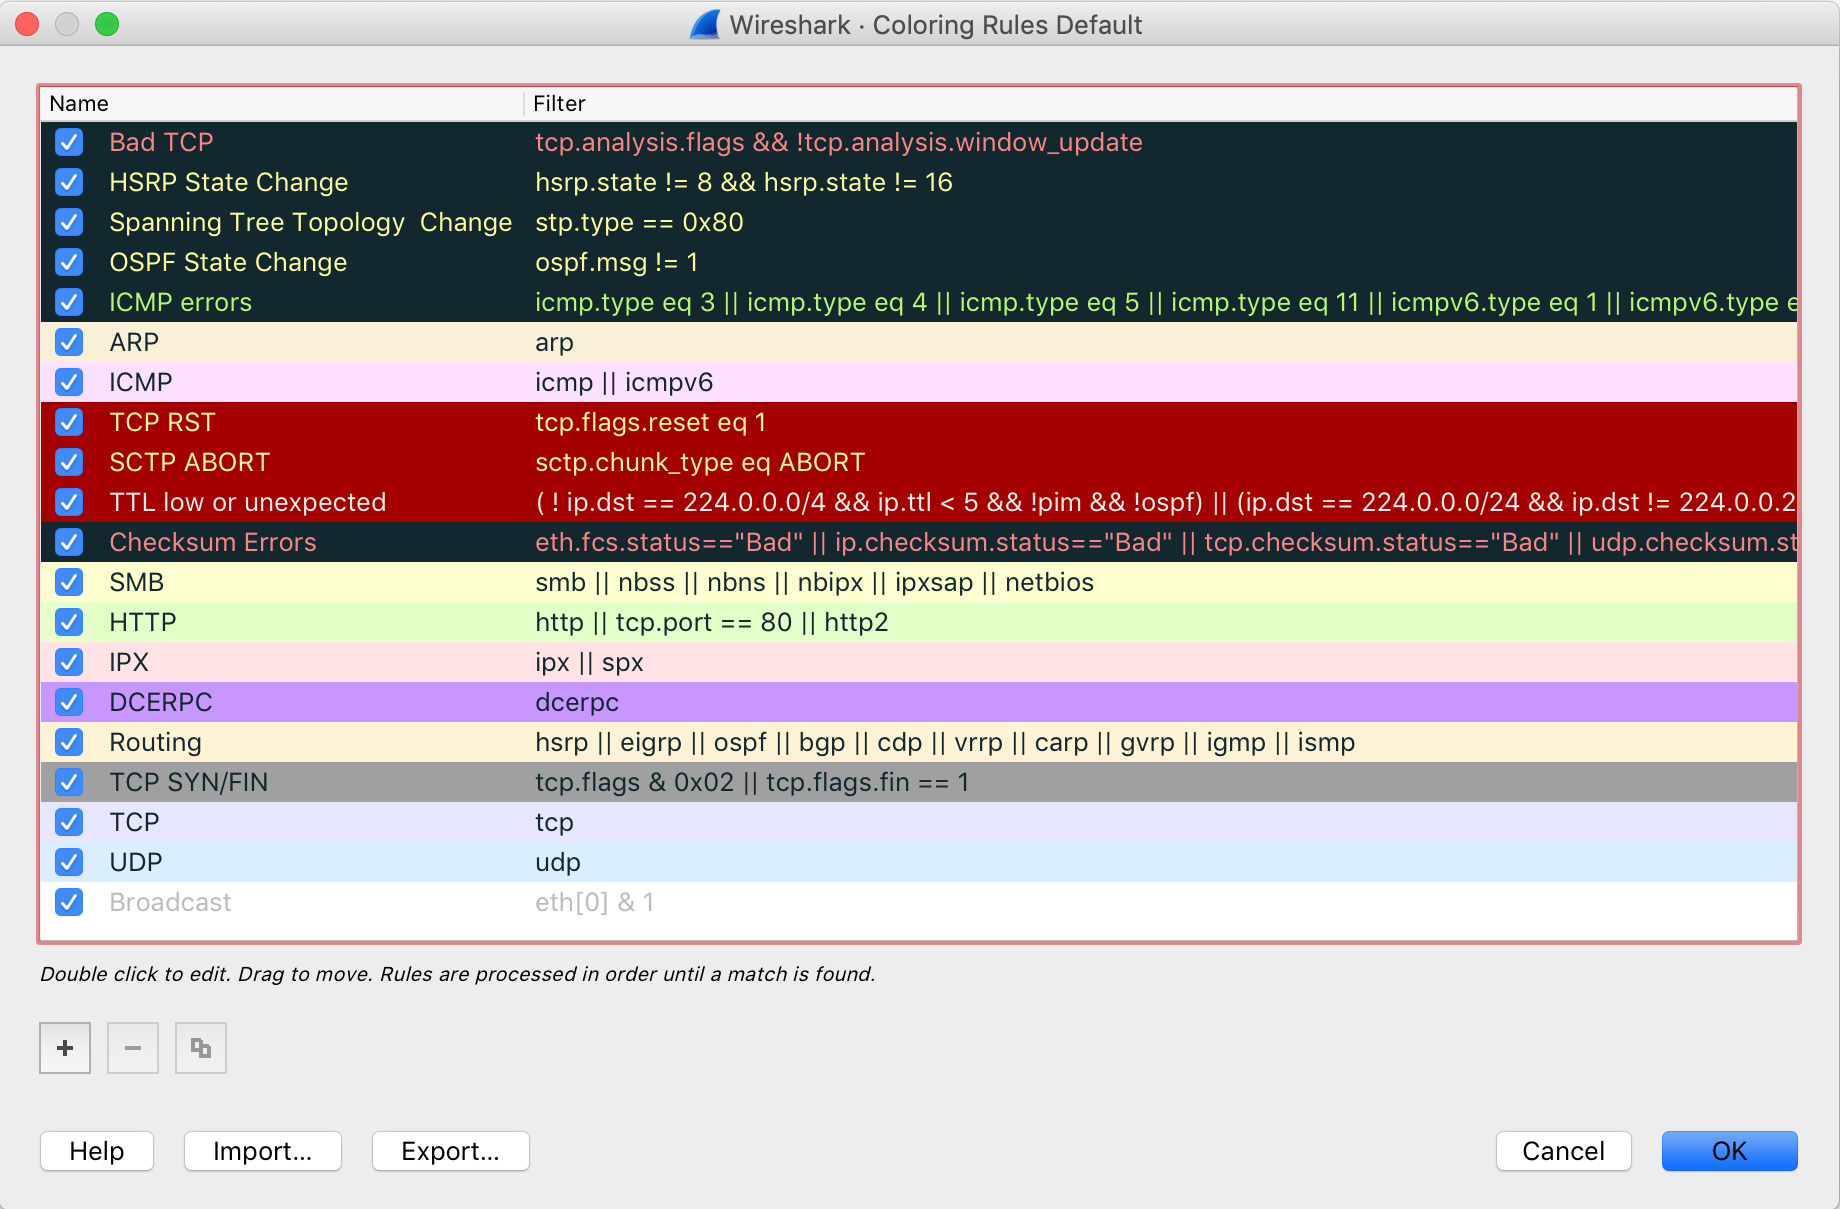
Colour Coding Packets
Each of the packets in the main view are colour-coded so we can easily understand what they mean. This can be changed by going to View > Colouring Rules. You can also add your own colouring rules in case if you wanted all packets with incoming IP address matching x.x.x.x to be blue.
Filtering Packets in Wireshark
A lot of network traffic is caught by Wireshark and most will be useless for us right now. With the help of filtering, we can get to the good stuff quickly.

- To try some of the filters below, paste them into the 'Filter Bar' at the top of the Wireshark Capture page.
- Click 'Expressions' to view all possible filter options. It's a laaarrrggee list. o_o
- As regular users of Wireshark, there may be some commands that you use often. Save your own custom filters for quick access by clicking the '+' button. Give it a label and it will show up beside the '+' button so next time, you can easily apply the filter in one click.
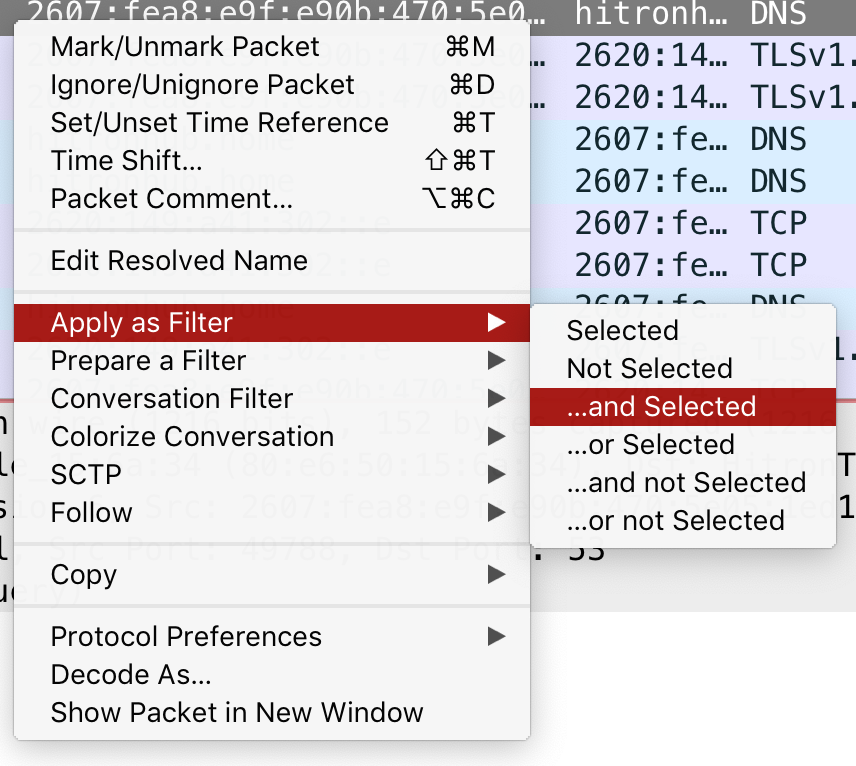
- Another easy way to apply filters is by right-clicking on a packet > "Apply as filter > ..." and selecting from one of the many options.
Try out some of the following filters.
Source IP Filter: ip.src == 192.168.1.1
Destination IP Filter: ip.dst == 192.168.1.1
Filtering with Logic:
    -----------+------------
           AND | and, &&
            OR | or, ||
        EQUALS | eq, ==
    NOT EQUALS | !=

Examples:
    tcp contains 01:01:04
    tcp.port eq 25 or icmp
    ip.addr == 10.43.54.65
    ! ( ip.addr == 10.43.54.65 )

Some popular filters:
    tcp.port == 443
    tcp.analysis.flags
    !(arp or icmp or dns)
    follow tcp stream
    tcp contains facebook
    http.response.code == 200
    http.request
Attacking & Defending with Wireshark
Attacking:
Packet Sniffing is a form of attack. You're looking to obtain sensitive information such as credentials when a person logs in or registers at a website. You're also able to find out what websites a person is visiting, files they are transferring, or applications they are using by linking Wireshark to your router.
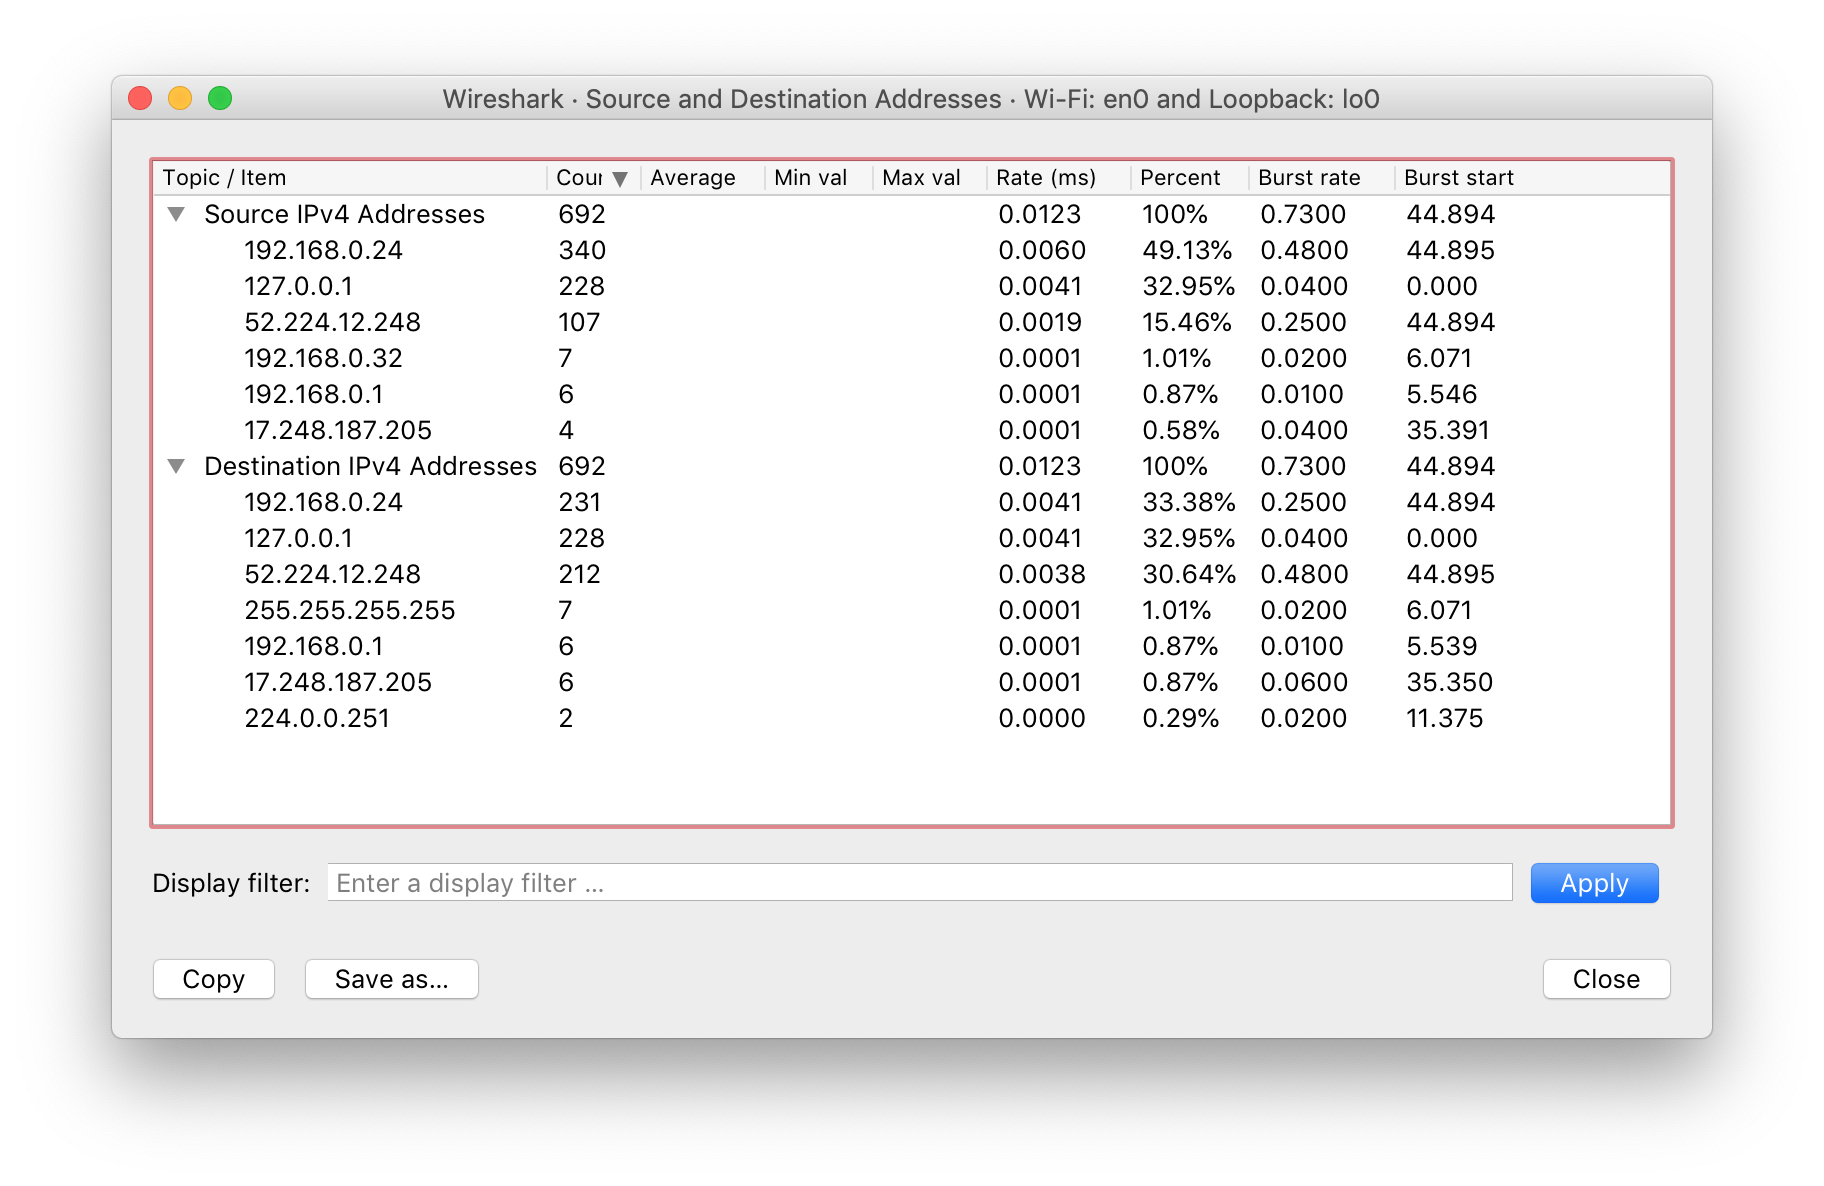
How to catch a network scan attack?Step 1: You'll notice a lot of packet drops (labelled [RST ACK] ).
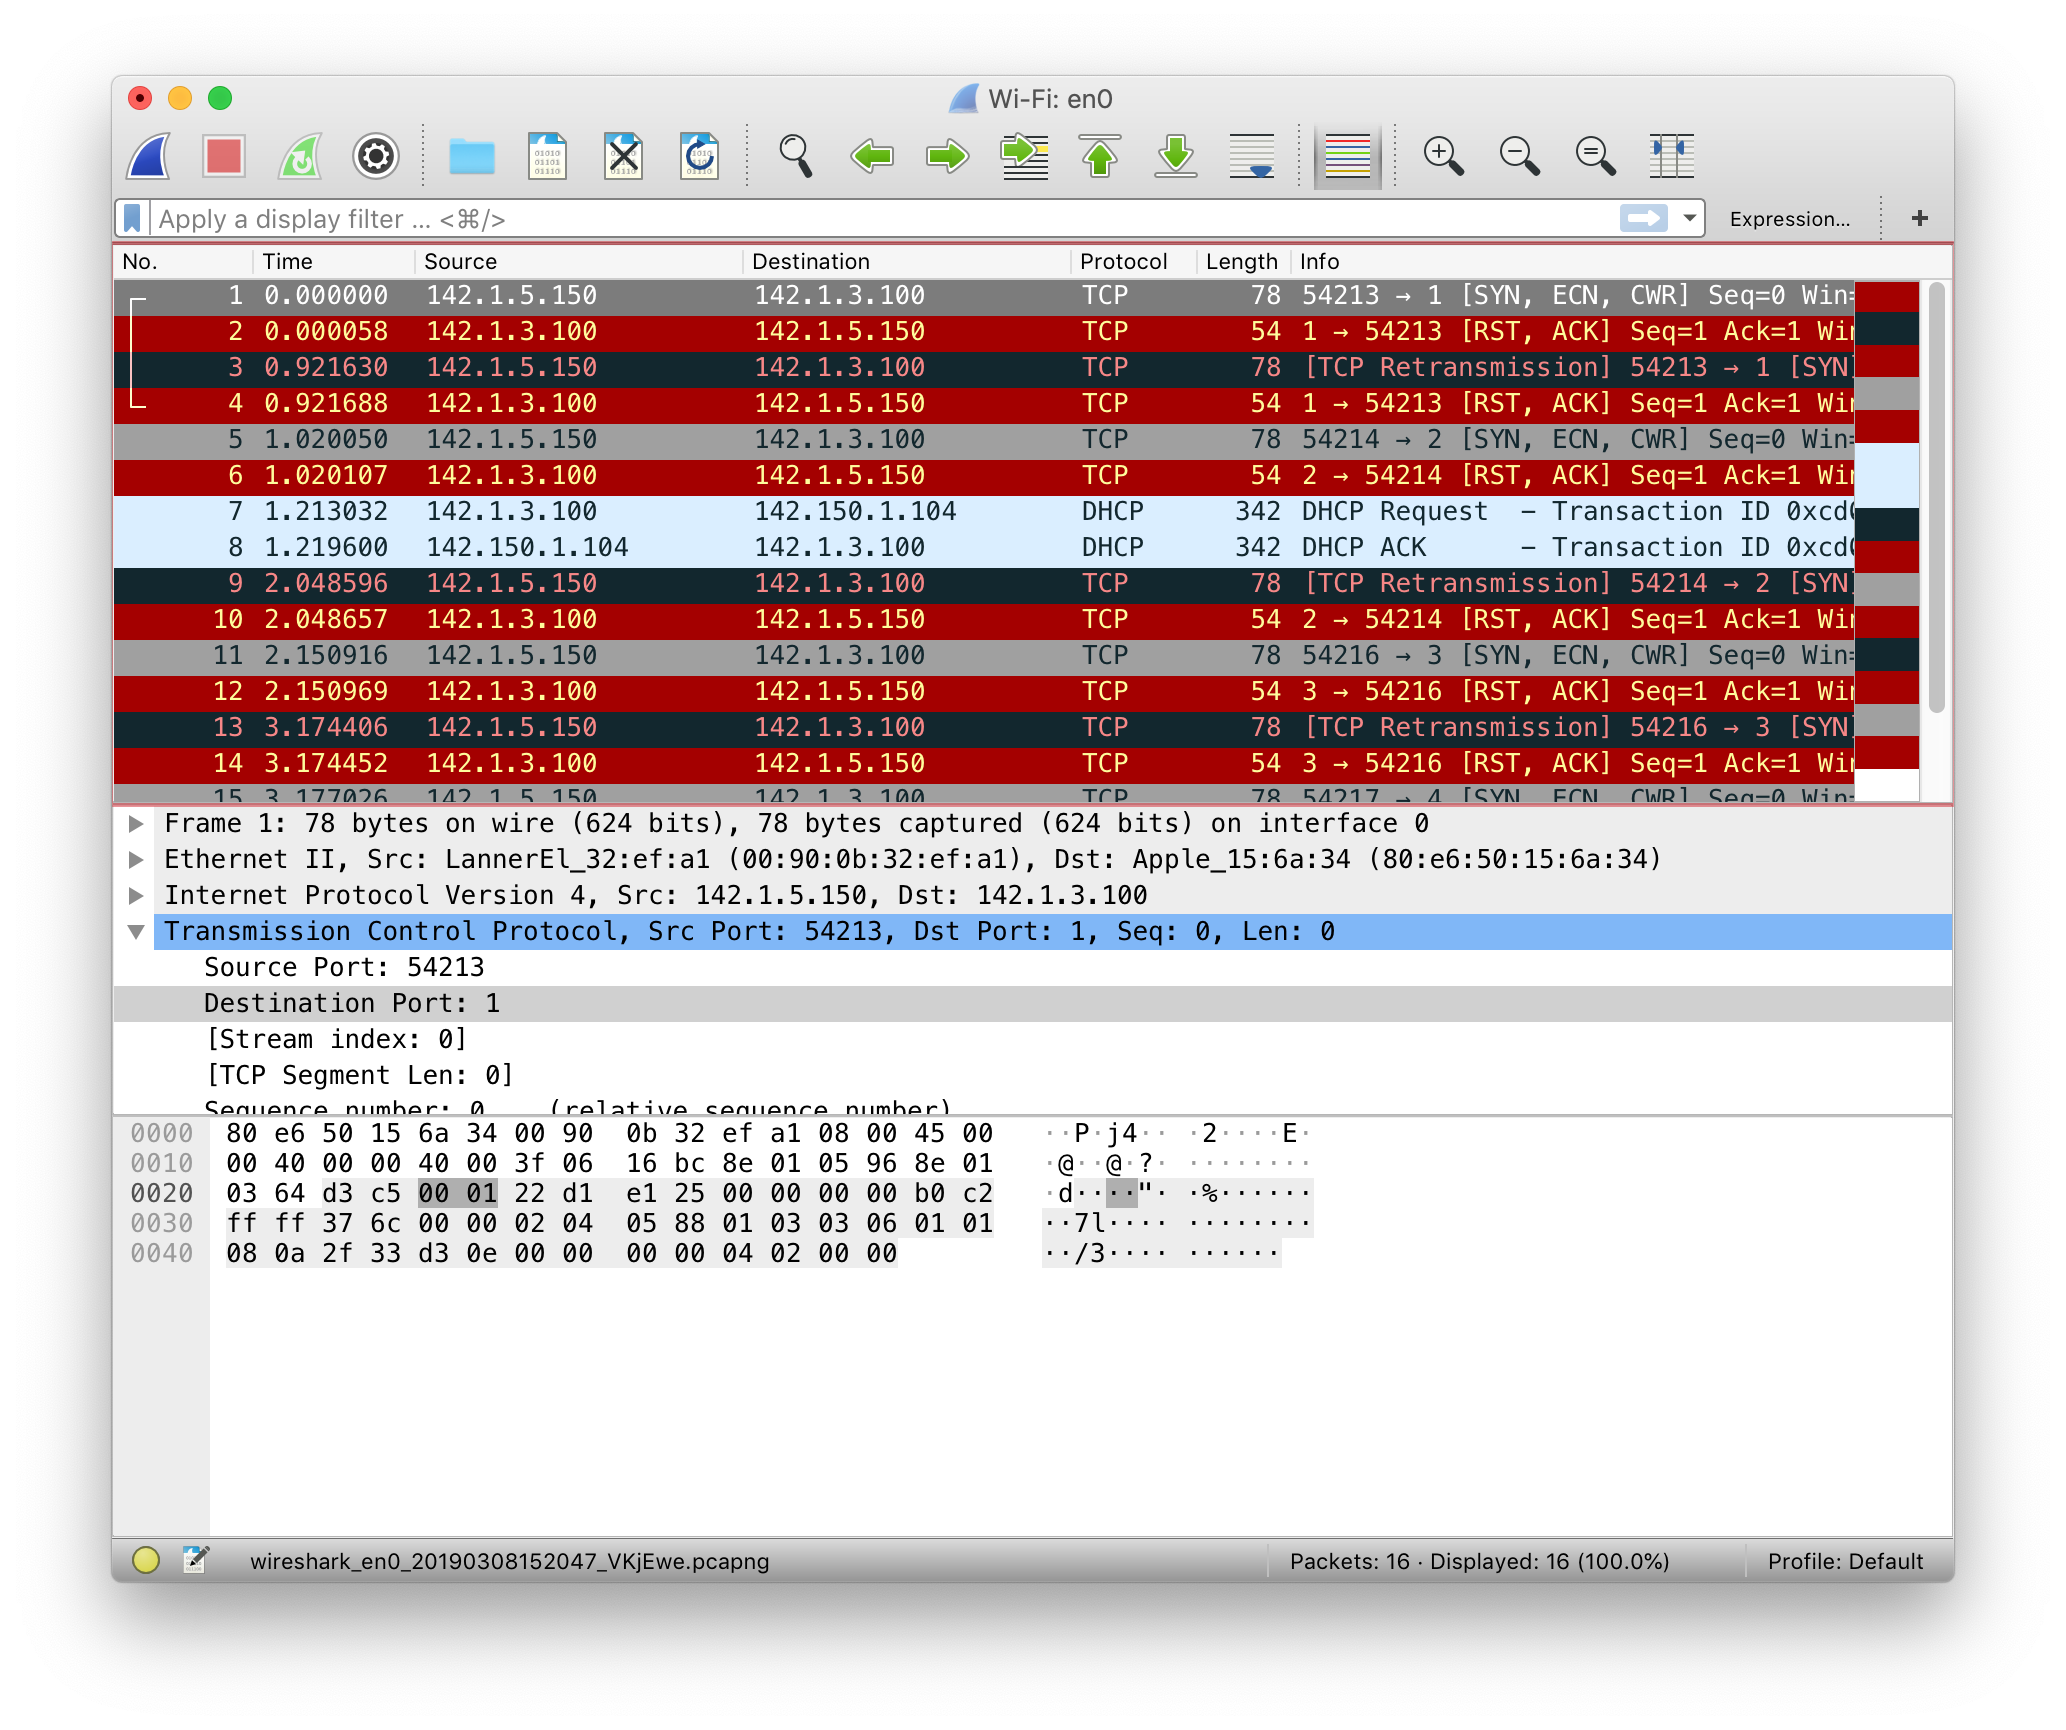
Step 2: Go to
Statistics > IPv4 Stats > Source and Destination Addressesand sort by count. If a specific IP address has a high count and you don't know the source IP, they are most likely attacking your system. At this point, you can make the necessary changes to block them.
 How to detect which local services are running (accessible to the web)?
- Find Destination Port ID in packet details > Transmission Control Protocol
- Open terminal, run the following
sudo lsof -i:PORT#
(replace 'PORT#' with actual port number). lsof
meaning 'LiSt Open Files' is used to find out which files are open by which process.- Find PID, open Activity Monitor (Mac) and find the PID.
Building Firewall Rules
Select a packet that you'd like to create a firewall rule for. Then click on Tools > Firewall ACL Rules. The first rule is generated by Wireshark. Feel free to modify this to fit your needs.
Tracking Your Packets for Development Purposes
For CSC490, we are building a Chrome extension that sends messages through Firebase to your phone (think of 2FA) and requests for credentials. Wireshark is helpful in identifying where our data packets were dropping.
For fun, explore the 'Statistics' tab and 'Analyze' tab for a boat-load of interesting features! Some that we found were interesting include:
- Statistics > I/O Graph: useful to catch bottlenecks in the system.
- Statistics > HTTP > Load Distribution: useful to see how different servers in a network are managing incoming requests.
- Statistics -> HTTP -> Request Sequence: useful to see which resources are being trasferred to a client, in what order and how many times.
Time for Demos
- Logging on unsecure website.
- We created a simple HTML/PHP login page on HTTP. First, we start a capture and then visit the page. After logging into the website, the capture is stopped.
- "http.request.method == 'POST'" filter is applied to get all packets that are of a POST type.
- When we submitted the form on the website, we sent a POST request which Wireshark caught.
- In the in-depth panel, under HTTP section, we are able to see the form values in plain text -- this includes the username and password.
- Logging on secure website.
- Same process, start a capture, and we used 'www.vfemail.net' as our website this time. However this time, there are no packets of type HTTP. This is because the website uses HTTPS.
- In this case, we are able to see a secure handshake being performed. Click on 'View > Find Packet'. In the drop down menu, select 'String' and search for vfemail.
- Once you've found a vfemail.net packet, right click on it > Follow > TCP stream. Now all the packets in your view are filtered down to anything related to vfemail. Go all the way to the top and you'll see the client (you) and the host (vfemail) establishing a secure connection.
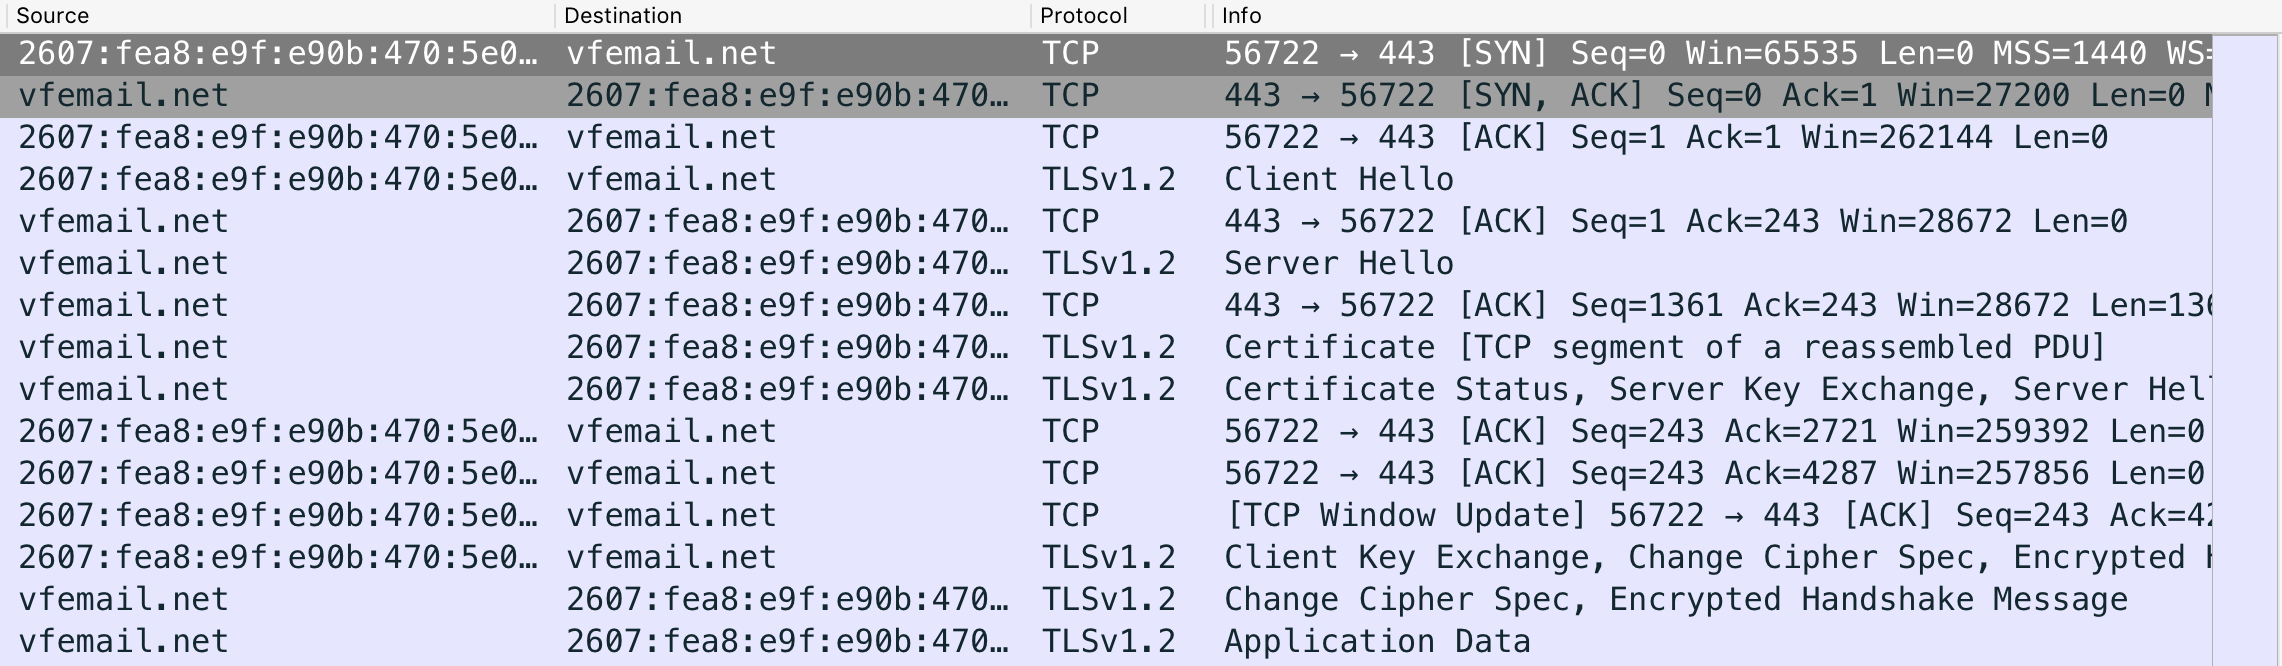
- In the image above, you can see the 'Client Hello', 'Server Hello', exchange of keys, the handshake, and then finally, application data which is encrypted.
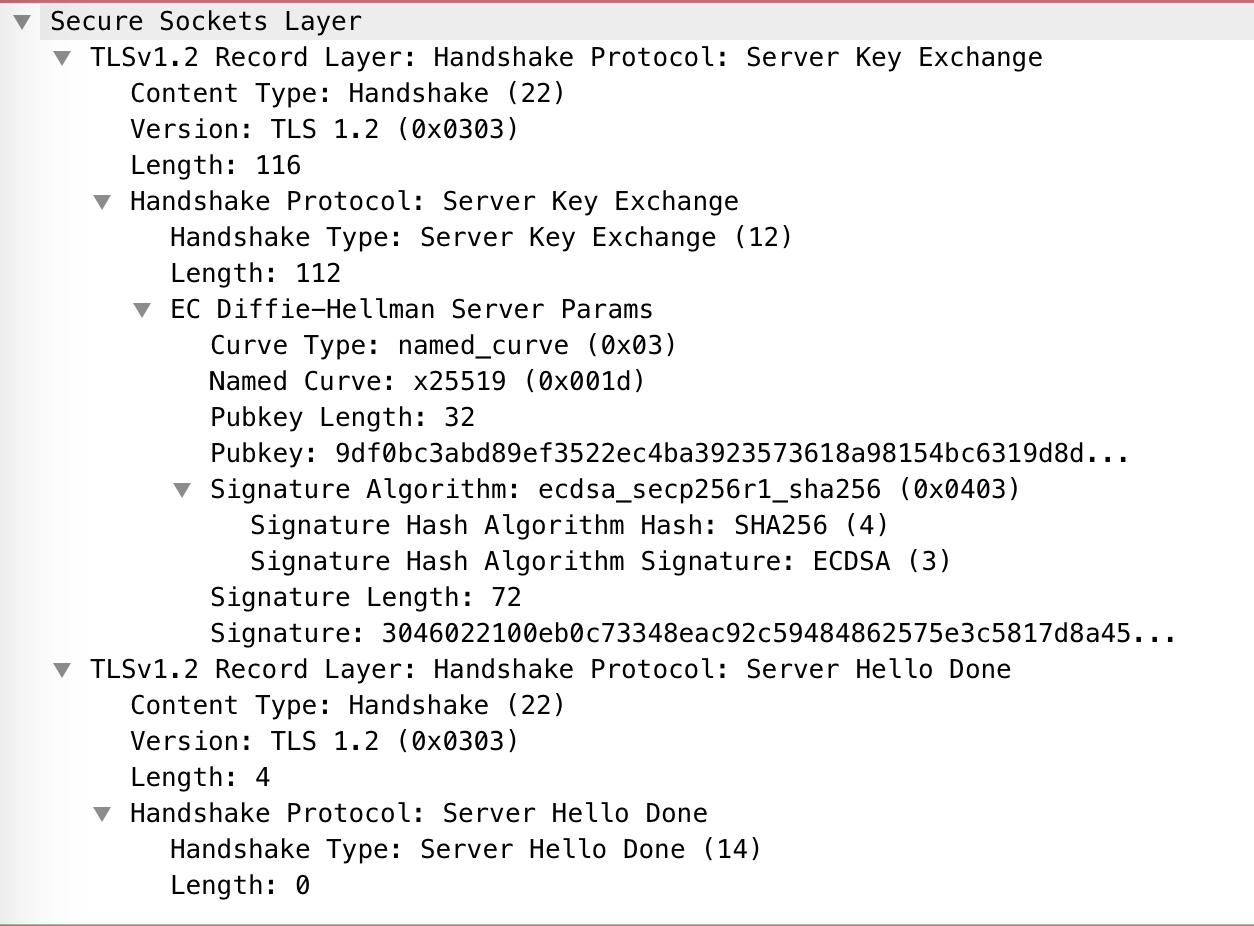
- And as before, always visit the in-depth panel for more information such as the image below:
- Various filtering examples.
- Incognito mode.
- Wireshark captures packets so whether you're on incognito mode or not, it doesn't matter -- the network traffic will be captured.
- Pinging / (Network Scan) DDoS attacks.
Additional Demos
- Exporting / Importing Wireshark capture files.
- https://db-ip.com/ : searching up IP location
Explore Wireshark Yourself.
True or False: Incognito Browser Mode can hide packets from Wireshark.False
Application, Transport, Network, Link Layer
http.request.method == "GET" && tcp.dstport eq 8080
Where else can you see Wireshark being useful?
How do we make Wireshark safe for testing and development, and stop it from being used for negative purposes?
Resources:
Wireshark Website: https://www.wireshark.orgWireshark Wikipedia: https://en.wikipedia.org/wiki/Wireshark
Setup apache (on Mac): https://medium.com/@JohnFoderaro/set-up-apache
Wireshark GUI Overview: https://networksecuritytools.com/wireshark-interface-gui-overview/
Wireshark Filtering: https://www.thegeekstuff.com/2012/07/wireshark-filter/
Wireshark Filtering 2: https://wiki.wireshark.org/DisplayFilters
Wireshark User Guide: https://www.wireshark.org/download/docs/user-guide.pdf
Wireshark Walkthrough: https://www.youtube.com/watch?v=TkCSr30UojM
DDOS Attack: https://www.youtube.com/watch?v=MphYj90_eJA
Network Layer Protocols: http://www.cs.toronto.edu/~ylzhang/csc358/files/lec01.pdf